What is Statistics?
What is Statistics?. Definition of Statistics Statistics is the science of collecting, organizing, analyzing, and interpreting data in order to make a decision. Branches of Statistics

What is Statistics?
E N D
Presentation Transcript
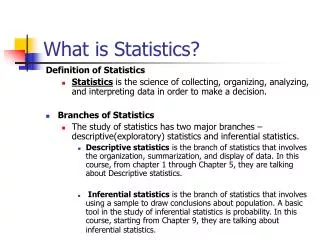
What is Statistics? Definition of Statistics • Statistics is the science of collecting, organizing, analyzing, and interpreting data in order to make a decision. • Branches of Statistics • The study of statistics has two major branches – descriptive(exploratory) statistics and inferential statistics. • Descriptive statistics is the branch of statistics that involves the organization, summarization, and display of data. In this course, from chapter 1 through Chapter 5, they are talking about Descriptive statistics. • Inferential statistics is the branch of statistics that involves using a sample to draw conclusions about population. A basic tool in the study of inferential statistics is probability. In this course, starting from Chapter 9, they are talking about inferential statistics.
Chapter outline • Individuals and variables • Categorical variables: • Pie Charts and bar graphs • Quantitative variables: • Histograms • Interpreting histograms • Quantitative variables: Stemplots • Time plots
Examining Distributions- Introduction • Definitions: • Individuals: the objects described by a set of data • Variable: any characteristic of an individual
Examples • College student data: every currently enrolled student – date of birth, gender, major, GPA and so on • Employee data: every employee – age, gender, salary, job type
Variables • Categorical variable: categories, groups • Quantitative variable: numerical values • Distribution of a variable: what values it takes and how often it takes these values
Examples • College student data: every currently enrolled student – DOB, gender, major, GPA, and so on • Employee data: every employee – age, gender, salary, job type • We can see distributions easily using graphs. It is possible to see distributions using numbers which describe the data.
Exploratory data analysis describes the main feature of data. • 1. Examine each variable • 2. Study the relationships among the variables • 3. Start with graphs and add some numerical summeries.
Categorical variables--- bar graphs and pie charts • Distribution of categorical variables categories by relevant count or percent of individuals. • Graphs: bar graph, pie chart • Pie chart: figure 1.1 (P. 7)/ must include all categories • Bar graph: figure 1.2 (P. 8)/heightindividual’s weight [gaps between bars and order is not important.] • Note: It’s only for single variable now (for example: college major, tire model, final exam grade).
Pie Chart in Figure 1.1 shows us each material as a part of the whole
Quantitative variables: histograms • How to make histograms • Step 1. Choose the classes. Divide the range of the data into classes of equal width. • Step 2. Count the individuals in each class. • Step 3. Draw the histogram. • Example 1.3
Interpreting histograms • Interpretation: What do we see? Overall pattern and striking deviations. • Overall pattern Shape, center, spread: symmetric, skewed to the right/left, clustered. • striking deviations Outlier
Quantitative variables: stemplots • Another way to display a distribution of quantitative variables. • How to make stemplots • 1. Sort data in increasing order first • 2. Separate each observation into a stem consisting of all but the final digit, and a leaf, the final digit. • 3. Write the stems in a vertical column with the smallest at the top, and draw a vertical line at the right of this column • 4. Write each leaf in the row to the right of its stem, in increasing order out from the stem.
Quantitative variables: stemplots • Data: 80, 52, 86, 94, 76, 48, 92, 69, 79, 45 • Step 1. Sort data in increasing order first • Step 2. Decide stem • Step 3. Fill in leaves
Examples and Exercises • Example 1.7 (P. 16) using Table 1.1 (P. 10) • Example 1.8 (P. 16)
Tips • 1. Rounding • 2. Splitting stems
Quantitative variables: stemplots • For small data sets, it is quicker to make and presents more detailed information • You keep data values
Time plots • It is for variables which are measured at intervals over time. • Example 1. The cost of raw materials for a manufacturing process each month. • Example 2. The price of a stock at the end of each day.
Time plots • To display change over time, make a time plot. Plot each observation against the time at which it was measured • 1. Put time on the horizontal scale • 2. Put the variable on the vertical scale • 3. Connect the data points by lines • Special case: time series (for regularly measured variable) • You can see: 1 )seasonal variation, 2) trend
Free tutoring The Math Assistance Complex (MAC) 122 Kell Hall • MAC website:(online tutoring available) www.gsu.edu/~wwwclc/mathlab.htm