Download
1 / 25
250 likes | 360 Views
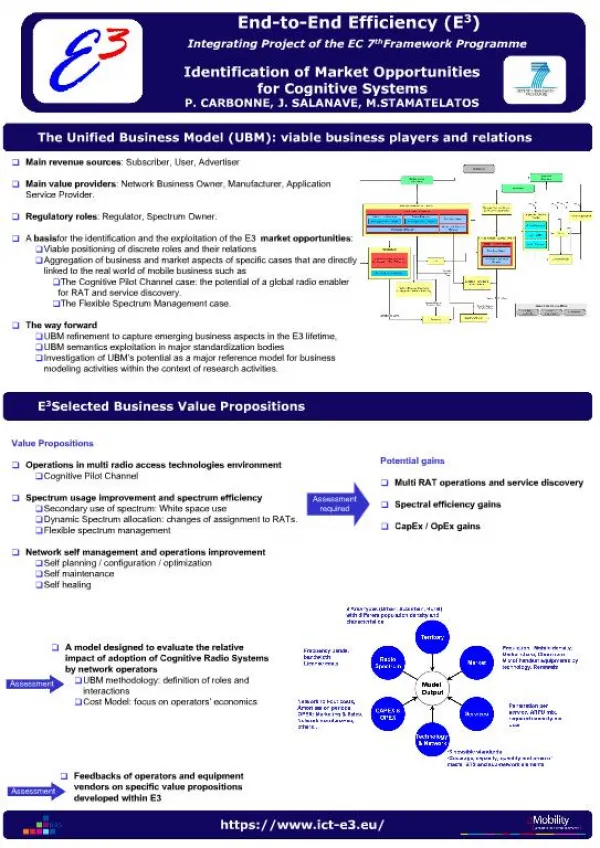
STAtistical and Regional dynamical Downscaling of EXtremes for European regions: some preliminary results from the STARDEX project. A project within the EC 5th Framework Programme 1 February 2002 to 31 July 2005 http://www.cru.uea.ac.uk/projects/stardex/ http://www.cru.uea.ac.uk/projects/mps/.

E N D
STAtistical and Regional dynamical Downscaling of EXtremes for European regions: some preliminary results from the STARDEX project A project within the EC 5th Framework Programme 1 February 2002 to 31 July 2005 http://www.cru.uea.ac.uk/projects/stardex/ http://www.cru.uea.ac.uk/projects/mps/ CM Goodess*, MR Haylock, PD Jones, A Bardossy, C Frei and T Schmith *Climatic Research Unit, Norwich UK c.goodess@uea.ac.uk
The STARDEX consortium c.goodess@uea.ac.uk
The STARDEX consortium c.goodess@uea.ac.uk
STARDEX general objectives • To rigorously & systematically inter-compare & evaluate statistical and dynamical downscaling methods for the reconstruction of observed extremes & the construction of scenarios of extremes for selected European regions & Europe as a whole • To identify the more robust downscaling techniques & to apply them to provide reliable & plausible future scenarios of temperature & precipitation-based extremes c.goodess@uea.ac.uk
Consistent approach: e.g., indices of extremes c.goodess@uea.ac.uk
STARDEX Diagnostic extremes indices software • Fortran subroutine: • 19 temperature indices • 35 precipitation indices • least squares linear regression to fit linear trends & Kendall-Tau significance test • Program that uses subroutine to process standard format station data • User information document http://www.cru.uea.ac.uk/projects/stardex/ c.goodess@uea.ac.uk
STARDEX Diagnostic extremes indices software • Fortran subroutine: • 19 temperature indices • 35 precipitation indices • least squares linear regression to fit linear trends & Kendall-Tau significance test • Program that uses subroutine to process standard format station data • User information document http://www.cru.uea.ac.uk/projects/stardex/ c.goodess@uea.ac.uk
STARDEX core indices • 90th percentile of rainday amounts (mm/day) • greatest 5-day total rainfall • simple daily intensity (rain per rainday) • max no. consecutive dry days • % of total rainfall from events > long-term P90 • no. events > long-term 90th percentile of raindays c.goodess@uea.ac.uk
STARDEX core indices • 90th percentile of rainday amounts (mm/day) • greatest 5-day total rainfall • simple daily intensity (rain per rainday) • max no. consecutive dry days • % of total rainfall from events > long-term P90 • no. events > long-term 90th percentile of raindays • Tmax 90th percentile • Tmin 10th percentile • number of frost days Tmin < 0 degC • heat wave duration c.goodess@uea.ac.uk
1958-2000 trend in frost days Days per year Blue is increasing
1958-2000 trend in summer rain events > long-term 90th percentile
1958-2000 trend in summer rain events > long-term 90th percentile Scale is days/year Blue is increasing
Investigation of causes, focusing on potential predictor variables e.g., Caspary & Bardossy - CL8 Caspary - HS19 Plaut - CL13 c.goodess@uea.ac.uk
Analysis of GCM/RCM output & their ability to simulate extremes and predictor variables c.goodess@uea.ac.uk
Heavy Alpine precipitation, 90% Quantile, Sept.-Nov. Observations Figure provided by Christoph Frei
Heavy Alpine precipitation, 90% Quantile, Sept.-Nov. Observations HadRM3 (GCM-driven 60-90) Figure provided by Christoph Frei
Heavy Alpine precipitation, 90% Quantile, Sept.-Nov. Observations CHRM (ERA-driven) HadRM3 (GCM-driven 60-90) HadRM3 (ERA-driven) Figure provided by Christoph Frei
Mean 90% quantile HadRM3 Christoph Frei
Mean 90% quantile HadRM3 HIRHAM Christoph Frei
Inter-comparison of improved downscaling methods with emphasis on extremes c.goodess@uea.ac.uk
Radial Basis Function daily precipitation downscaling - Colin Harpham/Rob Wilby, KCL
Radial Basis Function daily precipitation downscaling - Colin Harpham/Rob Wilby, KCL Prec90p: 90th percentile of rainday amounts 641CDD: max. no. consecutive dry days 644R5d: greatest 5-day total rainfall 646DII: daily intensity 691R90T: % of rainfall from events > long-term P90 692R090N: no. events > long-term 90th percentile Winter correlations for 27 stations in SE England
At the end of the project (July 2005) we will have: • Recommendations on the most robust downscaling methods for scenarios of extremes • Downscaled scenarios of extremes for the end of the 21st century • Summary of changes in extremes and comparison with past changes • Assessment of uncertainties associated with the scenarios c.goodess@uea.ac.uk
STARDEX STAtistical and Regional dynamical Downscaling of EXtremes for European regions http://www.cru.uea.ac.uk/projects/stardex/ http://www.cru.uea.ac.uk/projects/mps/ c.goodess@uea.ac.uk