Download
1 / 20
200 likes | 288 Views
Assessment of Point Defiance Bypass for High-Speed Intercity Passenger Rail. Carter Danne, PE, PTOE Parametrix , Inc. Presentation Outline. Project Definition & Orientation Effects on Roadways. Intent: Educate on lessons learned and leave you with a basic understanding of the project.

E N D
Assessment of Point Defiance Bypass for High-Speed Intercity Passenger Rail Carter Danne, PE, PTOEParametrix, Inc.
Presentation Outline • Project Definition & Orientation • Effects on Roadways Intent: Educate on lessons learned and leave you with a basic understanding of the project.
Who are the project leads? • Washington State Department of Transportation (WSDOT)www.wsdot.wa.gov • Federal Railroad Administration (FRA)www.fra.dot.gov
Who are the project partners? • Cities of DuPont, Lakewood, and Tacoma • Pierce County • Sound Transit • Clover Park School District • Joint Base Lewis McChord (JBLM) • Camp Murray • Federal Highway Administration (FHWA)
What was our role? • Prepare a Transportation Discipline Report (TDR) • Synthesize LOS, Delay, and Queuing information prepared by HDR • Complete a safety analysis
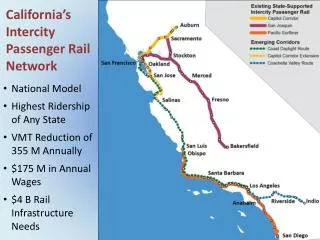
Where isPoint Defiance? Why bypass it?
What does it mean for rail operations? • Better service for Amtrak Cascades and Coast Starlight routes (14 more daily train trips) • Better multimodal connections with commuter rail and light rail • Fewer conflicts for freight rail on existing alignment
How does the Project affect roadways? • 21 at-grade crossings • 47 study intersections • Level of service (LOS) and intersection delay • Maximum queues • Safety
LOS and Intersection Delay • Roadway volumes similar between alternatives • One additional train per peak hour • Project has some improvements built into it LOS was of limited use as measures of effectiveness (MOE) because the project train trips were infrequent.
Maximum Queues • Roadway blockage duration approximately one minute or less when not near a station • Similar blockage time to commuter rail in corridor • Signal improvements built into the project would help Use graphics to supplement queue tables. Record maximum queues following the train crossing event until the system returns to normal.
Maximum Queues – Example Storage distances estimated to the nearest 25 feet. IS Distance to next upstream roadway. RR Distance reported to upstream railroad crossing. _ Queue extends beyond lane storage. B Blocks access to turn pocket or channelized right-turn.
Safety - Crossing Area Improvements • Do Not Stop On Tracks signs • Wayside horns • Median barriers • Sidewalks • Pre-signals • More advanced signal controllers
Predicted Accident Experience Methodology • Railroad-Highway Grade Crossing Handbook – Revised Second Edition 2007 • US DOT accident prediction model for railroad-highway grade crossings • Five years of most recently available accident data • Input crossing characteristics • Year 2030 conditions
Units of Accident Experience Remember, document units in meaningful terms to your audience.
Expected Accident Experience – Accidents per Million Train Crossings
Accident Experience Thresholds * As predicted by the US DOT Accident Prediction Formula. Note: These apply regardless of whether or not the improvements are economically justifiable.
Expected Accident Experience –Greatest Effects on Individual Crossings
Presentation Recap Basic understanding of the Project Effects on roadways Lessons learned More information:http://www.wsdot.wa.gov/Projects/Rail/PNWRC_PtDefiance/default.htm Carter Danne, PE, PTOE Parametrix, Inc. cdanne@parametrix.com office 425.458.6200 cell 206.909.7044 Thank You!