Download
1 / 30
310 likes | 556 Views
AC Measurements Using the Oscilloscope and Multimeter by Mr. David Fritz. Sine wave with a DC offset. V(t) = A + Bsin(2 π ft). f = frequency in Hz A = DC offset voltage (average voltage) B = Sine amplitude Vpp = 2B Vmax = A + B Vmin = A – B 120 V RMS from the AC line

E N D
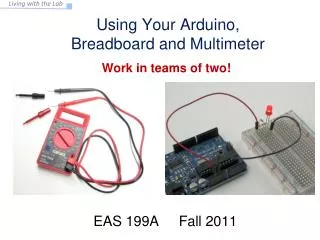
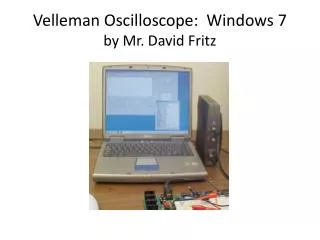
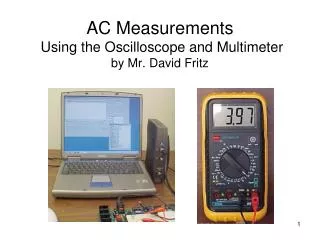
AC Measurements Using the Oscilloscope and Multimeterby Mr. David Fritz
Sine wave with a DC offset V(t) = A + Bsin(2πft) f = frequency in Hz A = DC offset voltage (average voltage) B = Sine amplitude Vpp = 2B Vmax = A + B Vmin = A – B 120 VRMS from the AC line has a peak voltage of 170V has a PP voltage of 340V A = 0, B = 170, f = 60
If A = 0, the average voltage = 0.But real power is still consumed by a load.
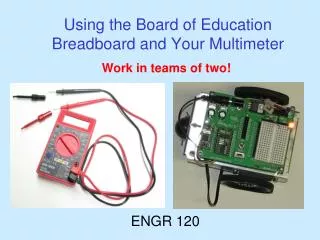
Electrical Power and RMS voltage • Electrical Power P = Voltage (V) x Current (I) • Our dilemma: The average voltage value of a sinusoidal, square, triangular, or ramp waveform with no DC offset is 0V. P = ? • P = V*I = V*V/R (As V↑, I↑ into a load. Ohm’s Law says V = I * R). • To calculate the power produced by an AC voltage, we must use the effective voltage, called the "Root Mean Square voltage" (abbreviated VRMS). Effective VRMS is also called “True VRMS” by many instrument manufacturers. • 120VRMS and 120VDC will produce the same power in a given load.
For the Sine waveform V(t) = A + Bsin(2πft) The effective voltage = True
Other waveform Shapes You will often run into other waveform types. The most common are • Square • Triangle • Ramp (or sawtooth) • Pulse • They may have DC offsets • Vpp = Vmax – Vmin The period T for any waveform is the time it takes for the waveform to repeat.
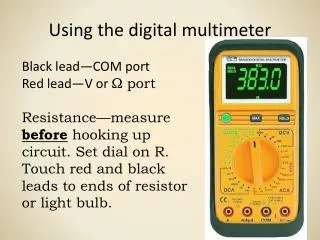
True VRMS from DMM measurements:(works with some meters for a sine wave with an offset) • Take the VDC measurement. (This is A.)Note: your DMMY64 does not always read the DC component if there is significant AC present. • Take VAC measurement. (This is ACRMS = B ∕ √2) • Square VDC, square VAC, add them together, take the square root of the sum.
AC measurements with the meter AC voltage measurements • Signal must be a pure sinusoid • Frequency range 40Hz < f < 400Hz • VACRMS <700V(Vmax < 1000V) AC current measurement • Only accurate for a pure sinusoid • Requires the same connections and precautions as DC current You may measure frequencies • up to 20kHz • 0.2 < VAC < 10
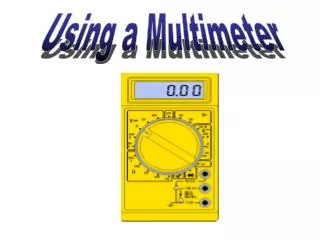
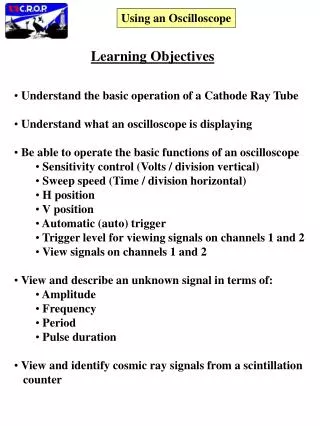
Oscilloscope Basics • The scope graphically displays a time varying voltage waveform. • The scope can be used to determine waveform amplitude, frequency, period, phase, DC and AC components, noise, shape, etc. • NOTE: The oscilloscope is designed to capture and display time varying waveforms – it is not the best instrument for measuring DC voltages!
Displaying the input waveform. • An A→D converter captures a series data points on the waveform. The 8 bit samples provide a resolution of 256 possible voltage levels. • These points are stored in memory and then displayed on the screen, using interpolation to smooth the waveform shape between data points. • The accuracy and resolution depend on the vertical scale selected. For best measurement accuracy, you should always try to display the waveform as close to full scale as possible.
Main Oscilloscope Components • Vertical display controlsScales the input voltage to set the size and position of the waveform. • Horizontal display controlsSets the “sweep rate” (time / division) and adds a horizontal position control. • Trigger System and controlsIf the horizontal sweep begins randomly, the waveform moves around. The trigger stabilizes the waveform by controlling where, on a waveform’s voltage and slope, the display trace begins each time. • This scope also has a built-in signal generator.
Vertical controls • Turn the channel display on & off (toggle the On button) • Set the vertical scale (press desired scale on Volts/Div.) • Set vertical position (slide bar) • Set input coupling (select buttons at bottom) • Set probe type (select buttons at bottom center) • use 1x for the black coax probes from Electronix Express. • use 1X or 10x for the probe supplied with Velleman scope • Autoset can be friend or foe!
Caution: Applying more than ±30V (peak)to the scope input will kill it!
Scope Input Coupling Input coupling may be: • DC Coupling displays all of a signal, including any DC offset.True RMS measurement requires DC coupling. • AC coupling strips the DC component from a waveform, leaving only the time varying portion of the signal. • GND disconnects the input signal.
Horizontal controls • To the right of the waveform display area is the Time/Div. horizontal scale setting buttons. • The Run button enables the Horizontal display. • The single button is used to display a single horizontal capture. • Below the waveform display area is a slide bar to move the waveform sideways along the horizontal scale.
Trigger controls • Turn the trigger on and off (use the buttons). If the trigger is off, the display will free run. • If the trigger is on and you see Waiting for trigger…Select the trigger source (buttons) Select whether to trigger on rising edge or falling edge of the waveform. (buttons)Adjust the trigger voltage level (slide bar) until you see Running.
Trigger markers tell you what the trigger is doing. There are markers on the edges of the scope waveform display that correspond to the waveform’s • trigger voltage level • trigger time (appears when you move the horizontal position slide bar to display the waveform before the trigger occurred)
Signal Generator built into the Scope • Generates sine, square, and triangle waveforms, plus other functions. Select the waveform type with the buttons. • Select frequency range with the buttons, then adjust the frequency with the slider • For Amplitude and DC offset, adjust the levels with the sliders or type the values into the boxes.The generator output (here) is set for a 500Hz, 5Vpp sine wave with a 0.98V DC offset - into a high Z load.
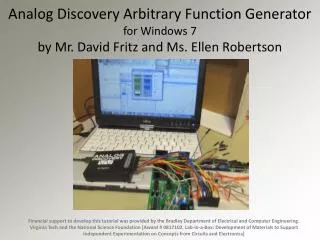
Starting the oscilloscope • Install the scope software from the Velleman web site - not the CD • Install the USB drivers from Velleman web site - not the CD • Attach the scope to the USB port • Launch scope control softwareStart > Programs > Velleman > PcLab2000LT(You will probably want to make a shortcut)
What if the software doesn’t find the scope? • You may see a pop-up that says you are in Demo mode because the software did not find the scope.This is usually not a problem. • Click Options > Hardware Setup > PCSGU250 > OK • The software will find the scope and the blue light will illuminateon the front of the scope.
If you still can’t get the scope to connect… • Make sure that you installed the software and drivers from the Velleman website. The CD included with your scope does not contain the latest versions.Try re-installing the drivers from the Velleman web site. • See the ECE Tech Support Guru for assistance. Branden McKagen bmckagen@vt.edu 346 Whittemore Hall 9:00-Noon M-F, 1:30-5:00 MWF • If you have a scope that will not work, see a GTA in the OpEL for assistance.
Your scope is connected, what now? • First do a calibration.With no cables connected to the scope, Click Options > Calibrate > OKWait for the Calibraion complete pop-up and click OK • Always run a calibration before you begin measurements if the scope and/or computer have been off.
Set up the scope’s Signal Generator • Select the waveform type with the buttons. • Select frequency range with the buttons, then adjust the frequency with the slider • For Amplitude and DC offset, adjust the levels with the sliders or type the values into the boxes.In this case, the generator output is set for a 500Hz, 5Vpp sine wave with a 0.98V DC offset into a high Z load.
Set up the scope for measurements 1 2 • Connect a BNC / Clip lead from the signal to be measured to the CH1 and/or CH2 Input(s). • Click Run (see slide 17). • Turn on the Trigger (see slides 18 &19) and the CH1 and/or CH2 display(s) (see slide 14) • Adjust the vertical (see slides 14 &16), horizontal (see slide 17), and trigger controls (see slides 18 &19) to get your waveform on the screen. 4
Visually measuring the waveform On the scope display, Vmax, Vmin, Vpp, and period can be obtained by • counting the number of divisions • multiplying by the vertical scale for voltages • multiplying by the horizontal scale for time period.
Measure the Waveform Parameters • Click View > Waveform Parameters…This opens a pop-up for meaurements. • Click each box to place (or clear) a check for measurements you wish to include (or exclude).DC Mean is approximately the DC offsetAC RMS is VRMS without the DC offsetAC + DC RMS is the True VRMS (see sheet 5)Amplitude is the same as Peak-to-Peak
“Waveform Parameters” Accuracy • A waveform that vertically occupies most of display will have more measurement accuracy than a waveform that is small on the display. • Best accuracy seems to require at least two waveforms horizontally. • The measured values will be reasonably accurate as long as the scope display is running. • If you see “?” after the value, the waveform measurement does not fit into the display window and is out of measurement range. • If you have “Waiting for trigger” showing, any waveform changes will not appear in the display or Waveform Parameters measurements.
Remember this: • Sin(x) varies from -1 to +1 so Bsin(x) varies from –B to +B and (for voltages) Vpp = 2B • The scope has an “Amplitude” measurement that is actually the same as Vpp. Amplitude on the scope ≠ B • The DMMY64 assumes all time varying signals are sinusoids. This meter will provide an ACRMS measurement for pure sinusoids; it will not accurately measure anything that is not either pure DC or a pure sinusoid between 40Hz and 400Hz.