Download

1 / 30
300 likes | 434 Views
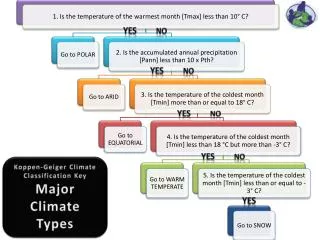
ESS Climate Exam Key. 28 May 2013. 1. Why are there no tropical cyclones in the SE Pacific and very few in the South Atlantic? (mark all that apply). Cold ocean currents Strong wind shear in the upper atmosphere from the Roaring Forties.

E N D
ESS Climate Exam Key 28 May 2013
1. Why are there no tropical cyclones in the SE Pacific and very few in the South Atlantic? (mark all that apply) • Cold ocean currents • Strong wind shear in the upper atmosphere from the Roaring Forties. • Weak wind shear in the upper atmosphere due to the Doldrums • There ARE tropical cyclones out there; they just never make landfall. • None of the above
2. Which island generally experiences the most intense tropical cyclones? • Madagascar • Sri Lanka • Philippines • Tahiti • Cuba
3. Which of the following cities might be struck by a typhoon in October? • Honolulu • Mumbai • Tokyo • Miami • Sydney
4.Tropical cyclones are important climatological phenomena in that they act to … • Cool the oceans • Bring salt up from the depths. • Move sediment around • Disperse heat from the tropics into the temperate zones
5. Why does the Pacific Basin produce so many more tropical cyclones than any other? • Its size • Its sea surface temperature • Its depth • Its tectonic activity
Sandy: The Life and Times of Frankenstorm It was the storm of a lifetime—a massive, freakish confluence of a tropical hurricane and a winter, extratropical vortex. It ravaged the mid-Atlantic, Northeast, and Ohio Valley regions for three days from October 29-31, 2012 This was Superstorm Sandy. The 2012 Atlantic hurricane season was once again in hyperactive mode, breeding 19 named storms. Since 1995, most years have tallied storm counts far exceeding the long-term average of 11 named systems. And in recent years hurricanes have become exceptionally large, including Isabel (2003), Ike (2008), and Irene (2011). But something as outlandish as Sandy seemed to strain the limits of Mother Nature. Figure 1 provides a visual roadmap of the major atmospheric and oceanic elements that conspired to produce the superstorm. The various pieces were highly dispersed, from the Caribbean to Greenland to the Great Lakes. The storm began as an unusually intense, late-season hurricane south of Cuba, which rapidly intensified to nearly Category 3 hurricane status. This required very warm ocean surface waters—Element 1 in Figure 1. Sandy's passage across the mountainous terrain of Cuba temporarily knocked the wind from its sails. But after weakening to a humble Category 1, Sandy began to grow in size. And continue to grow. The maelstrom eventually swelled to more than 1,100 statute miles in diameter, becoming the largest tropical cyclone in Atlantic basin history. Two days before landfall, Sandy developed a system of weather fronts. It bore resemblance to a large, winter-like Nor'easter, yet with a distinctly tropical core. The only word to describe such a cyclone is a “hybrid.” A large, intense trough in the mid-latitude jet stream (Figure 1, Element 2) and its surface cold front (Figure 1, Element 3) contributed directly to the transition of Hurricane Sandy to a hybrid storm. And Sandy was the only tropical cyclone in United States history for which both hurricane and blizzard warnings were issued simultaneously.
6. Of the phenomena that combined to make Sandy such a destructive storm, which were completely oceanographic in nature? (mark all that apply) The “Blocking High” Anticyclone sitting off of Greenland The Mid-latitude Jet Stream The Gulf Stream The high tides that coincided with storm surges. The Low Pressure Trough over the Eastern Seaboard 7. Which state experienced the strongest winds? A. ME B. CT C. DE D. MD E. NJ • 8. Which city experienced the highest storm surge? • 9. The highest lake waves? • A. Portland, ME • B. Newport, RI • C. New York, NY • D. Cleveland, OH • E. Chicago, IL • The most unusual aspect of this “Frankenstorm” was the blizzard that occurred in the Appalachians as a direct result of this hurricane! Why did snow not occur further east or further west? • It was a lake effect storm • The Great Lakes weren’t frozen yet. • The moisture from the hurricane froze in the cold temperatures at 5,000 feet as it went over the mountains. • The Greenland High moved south over WV.
11. What did Sandy gain as it transformed from a hurricane into an extratropical cyclone? (mark all that apply) • An eyewall • Size • Frontal system • Heat in its core • Wind speed
Interaction with El Niño- how hurricane frequency may be affected Researchers continue to investigate possible interactions between hurricane frequency and El Niño. El Niño is a phenomenon where ocean surface temperatures become warmer than normal in the equatorial Pacific. In general, warm El Niño events are characterized by more tropical storms and hurricanes in the eastern Pacific and a decrease in the Atlantic, Gulf of Mexico and the Caribbean Sea. The 1997-98 El Niño event agreed with this theory. In 1997, the Atlantic Ocean had 7 named storms, of which 3 became hurricanes and only one of them intense. Each of these figures were below average yearly values. The average hurricane season is compared against the average El Niño season below. The primary explanation for the decline in hurricane frequency during El Niño years is due to the increased wind shear in the environment. In El Niño years, the wind patterns are aligned in such a way that the vertical windshear is increased over the Caribbean and Atlantic. The increased wind shear helps to prevent tropical disturbances from developing into hurricanes. In the eastern Pacific, the wind patterns are altered in such a way to reduce the wind shear in the atmosphere, contributing to more storms.
12. When an El Niño occurs, which states should expect MORE hurricanes?(Mark all that apply) • Baja California Sur • Hawaii • Quintana Roo • Tamaulipas • Texas
Climate Change:US Atlantic braces for active hurricane season WASHINGTON, May 23, 2013 (AFP) - The United States is gearing up for more Atlantic hurricanes than usual this year, triggered by warmer water temperatures than average, US forecasters said Thursday. The National Oceanic and Atmospheric Administration's Climate Prediction Center predicted that the six-month Atlantic hurricane season that begins June 1 will see 13 to 20 named storms, seven to 11 hurricanes and three to six major hurricanes, with winds of at least 111 miles (178 kilometers) per hour. In comparison, a normal season produces 12 named storms, including six hurricanes and three major ones. "This year, oceanic and atmospheric conditions in the Atlantic basin are expected to produce more and stronger hurricanes," said Gerry Bell, lead seasonal hurricane forecaster with NOAA's Climate Prediction Center. "These conditions include weaker wind shear, warmer Atlantic waters and conducive winds patterns coming from Africa." The strong West African monsoon is blamed for high Atlantic hurricane activity since 1995, while the Atlantic Ocean and the Caribbean Sea have seen warmer water temperatures than average. The El Nino band of abnormally warm ocean water temperatures is not expected to develop and suppress the formation of hurricanes this year, according to NOAA. NOAA stressed that its outlook was not a hurricane landfall forecast and does not predict how many storms will hit land or where they will strike.
13. What is NOT expected to be a factor in the development of hurricanes in the Atlantic Basin this year? • West African Monsoon • El Niño Southern Oscillation • Weak high-altitude winds • High sea surface temperatures in the Atlantic and Caribbean
14. If sea surface temperatures remain like this in the Pacific, would you predict A)more, or B) less hurricanes in the Eastern Pacific Basin for this year?
15. Which city experiences average monthly temperatures greater than 18°C (64°F), with a winter dry season of more than two months with less than 60 mm (2.4")? • Brownsville, TX • San Diego, CA • El Paso, TX • New York, NY • Miami, FL
16. What is our Köppen classification here in Spring, TX? A. Aw B. BSk C. Cfa D. Dfa E. H
17. What is the MAIN determining factor for our local climate? • Nearby sea surface temperature • Altitude • Latitude • Local wind patterns • Plant life
18. What is the dominant climate along our latitude? • BSh • BWh • Cfa • Dwd • ET 19. As topographic relief increases, climate variations tend to A)increase or B) decrease.
20. What TWO things are displayed on a climograph? • Average monthly temperature • Distance from ocean • Topography • Winds • Average monthly precipitation
21 -25. Match the climograph with its appropriate climate. 21. BWh 22.Cfa 23. Cfb 24. Csa 25. ET A C B D E
26. If climate change is going to make southeast Texas to be more arid, then what will happen to our local climograph? • The line graphs will shift upwards. • The line graphs will shift downwards. • The bar graphs will grow shorter. • The bar graphs will grow taller.
Allison’s Story Allison is the only Atlantic tropical storm to have its name retired without ever having reached hurricane strength. At 1200 UTC on June 5, 2001, the disturbance developed a broad, low-level circulation, and was classified as Tropical Storm Allison, the first storm of the 2001 Atlantic hurricane season. It was expected to be hindered by cool offshore sea surface temperatures, but the storm quickly strengthened to attain peak sustained winds of 60 mph (95 km/h), with tropical storm-force winds extending up to 230 miles (370 km) east of the center, and a minimum central pressure of 1000 mbar.
Allison’s Story, cont. • Under the steering currents of a subtropical ridge that extended in an east–west orientation across the southeast United States, Allison weakened while nearing the Texas coastline, and struck near Freeport, Texas with 50 mph (80 km/h) winds. Inland, the storm rapidly weakened, and the National Hurricane Center discontinued advisories early on June 6. The depression drifted northward until reaching Lufkin, Texas, where it stalled due to a high pressure system to its north. While stalling over Texas, the storm dropped excessive rainfall, peaking at just over 40 inches (1,033 mm) in northwestern Jefferson County.On June 7, the subtropical ridge off Florida weakened, while the ridge west of Texas intensified. This steered Tropical Depression Allison to make a clockwise loop, and the storm began drifting to the southwest. As the center reached Huntsville, Texas, a heavy rain band began to back build from Louisiana westward into Liberty County, Texas, which had caused additional flooding.At the time, the system had a minimum central pressure of about 1004 mb and maximum sustained winds of about 10 mph (16 km/h). • Late on June 9 and early on June 10, Allison's remnants once again reached the Gulf of Mexico and emerged over open waters.The low once again became nearly stationary about 60 mi (100 km) south of Galveston, Texas, and despite more favorable upper-level winds, it showed no signs of redevelopment.Due to dry air and moderate westerly wind shear, the storm transformed into a subtropical cyclone. While the subtropical depression moved eastward, a new low level circulation redeveloped to the east, and Allison quickly made landfall on Morgan City, Louisiana on June 11.
27. What caused Allison to turn around and go back into the Gulf after having traveled inland over 100 miles? • A “blocking high” anticyclone to the north • Weakening ridge to the east • Strengthening ridge to the west • All of the above • None of the above
28. How many tropical cyclones are in this picture? • 1 • 2 • 3 • 4 • 5
29. How many typhoons are in this picture? 30. How many cyclones? • 1 • 2 • 3 • 4 • 5
31. Which systems are tropical?32. Extratropical?33. Which letter marks the ITCZ? A D C B E
34. Which weather systems are north of the equator? (mark all that apply) E C B D A
35. If wind speed correlates positively with eye development and tightness of spiral, which tropical cyclone has the higher winds? A36. Are these A) north or B) south of the equator? A B
While nothing like 2011, we are still in the throes of a drought cycle. 37. What is our local drought intensity here in Spring, TX? Abnormally Dry Moderate Severe Extreme Exceptional