Download
1 / 20
200 likes | 284 Views
Explore the economic impact and growth of Downtown DC, including key statistics on employment, hotel performance, restaurant growth, visitation, and transportation improvements. Discover future developments and new places beyond 2011. Engage with social media for updates.

E N D
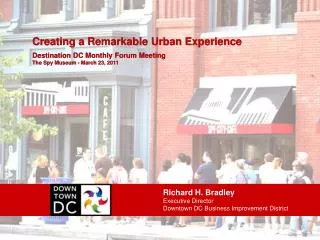
Creating a Remarkable Urban Experience Destination DC Monthly Forum MeetingThe Spy Museum - March 23, 2011 Creating a Remarkable Urban Experience Destination DC Monthly Forum MeetingThe Spy Museum - March 23, 2011 Richard H. BradleyExecutive DirectorDowntown DC Business Improvement District
Economy • Total development in a decade
Economic Impact of Downtown • On Washington, DC • At the end of 2009: • 1.5% of population • 2% of land area • 7% of retail space • 26% of all office building development and renovation investment • 15% of local tax and other revenues • 17% of museums • 23% of theater seats • 24% of Zagat-rated restaurants • 26% of jobs • 34% of morning Metrorail exits(YTD FY 2010) • 40% of total private and government office space • 51% of hotel rooms
Downtown BID • Boundaries
Economy • Downtown BID employment growth continues
$200 $200 $150 $150 $100 $100 $50 $50 97 99 05 07 97 99 01 03 05 07 09 01 03 09 Economy • Hotel performance, 1997 - 2010 Revenue Per (1) Available Room ($) Occupancy (%) Average Room Rate ($) 80% 60% 40% 20% 97 99 01 03 05 07 09 • Average room rates were $215 per night • The occupancy rate was 77% • Revenue Per Available Room, $165 • In 2010 Downtown BID area room revenues set a new performance record: $553 million up 3.2% from 2009.
Economy • Restaurant growth by year, 2000 - 2009 Projection 143 Number of Restaurants 134 125 133 125 116 100 110 104 103 The BID had a net gain of nine new destination restaurants in 2009 … bringing the total to 131. 98 96 89 85 75 50 25 Number opened 00 16 6 10 01 8 7 1 02 13 6 7 03 9 7 2 04 10 5 5 05 12 5 7 06 13 1 - 6 07 16 4 12 08 15 6 9 09 17 9 8 10 4 5 0 11 11 1 10 Number Closed Net Change
Economy • Visitation
Economy • Downtown residential population Thousands 47.8 Downtown BID area plus 10 blocks W, N & E 59.9 50 Downtown BID area 34.2 34.1 47.8 Projection There are about 87-hundred residents in the Downtown BID area, an increase of 45-hundred since 2000. 30 9.7 8.7 8.7 10 3.6 4.2 1990 2000 2008 2009 2014
Economy • US city class A rents compared (per SF)
Improvements in the District • Places
Transportation More choices
PlacesSidewalk cafes: a good indicator of livability • More than 2,500 seats • 123 cafes • Up from 95 cafes last year
PlacesCrime: Total BID incidents per year incidents year
Design architect: Richard Rodgers • 1,175-room, 46-suites • 38000 SF of retail • Meeting space will include • A 30,000-square-foot grand ballroom • Two 10,800-square-foot junior ballrooms • More than 53,000 square feet of meeting rooms, • an 18,800-square-foot indoor Event Terrace and a 5,200-square-foot Rooftop Terrace New Places - Beyond 2011 • Headquarters Hotel
New Places - Beyond 2011 • City Center DC
New Places - Beyond 2011 • New transportation options Streetcar on K Street Click for internet video • Metro to Dulles Airport
425 L Street Constitution Square Eastbanc in Georgetown Foundry Lofts at the Yards New Places - Beyond 2011 • Residences Hines School, SE at Eastern Market Archstone Location for Avalon Bay 3rd & Eye, NE CityCenter DC 360 Degrees H Street
Social Media • New ways to reach out • Lorem ipsum dolor. • Fusce ultricies, tellus sit • amet semper accumsan enim dui tincidunt • nisl, at bibendum massa erat in nisl. • Sed consequat, mi a tempus sceleris • quevelit risus pulvinar velit, et sollicitudin • Duis quis sem ut luctus consequat lacus • Aliquam iaculis. Cras blandit. In placerat.