Understanding Hurricanes: Structure, Movement, and Forecasting Techniques
This overview delves into the nature of hurricanes, focusing on their structure, movement, and forecasting methodologies. It explores the theoretical aspects of hurricanes, including the effects of vorticity and synoptic conditions on their path. The influence of environmental factors, such as the Rossby effect and storm surges, on hurricane dynamics is also examined. Additionally, it highlights challenges in forecasting hurricane movements and the potential impacts of landfall events. This comprehensive insight is essential for better preparedness and response to tropical cyclones.


Understanding Hurricanes: Structure, Movement, and Forecasting Techniques
E N D
Presentation Transcript
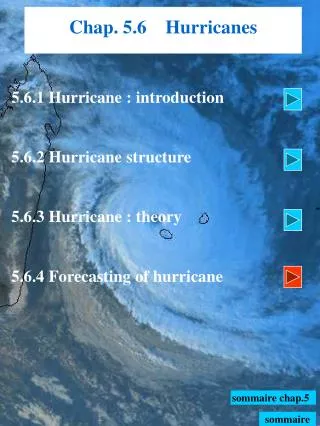
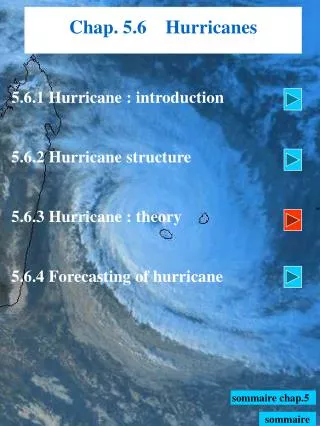
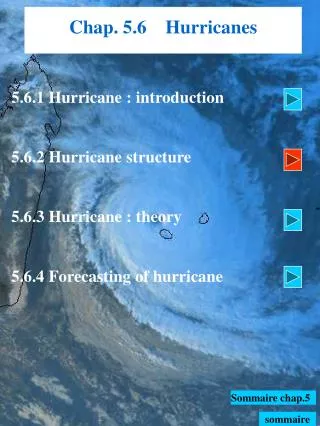
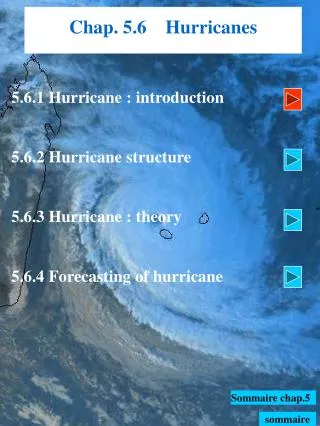
Chap. 5.6 Hurricanes 5.6.1 Hurricane : introduction 5.6.2 Hurricane structure 5.6.3 Hurricane : theory 5.6.4 Forecasting of hurricane sommaire chap.5 sommaire
5.6.4 Forecasting of hurricanes : Move of hurricane Storm surge Favorable synoptic conditions Unfavorable synoptic conditions Interannual variability Technical forecasting Sommaire hurricane sommaire
5.6.4 Forecasting of hurricanes :Move of hurricane • The vorticity equation, written under the hypothesis of • barotropic atmosphere and above boudary layer, • indicates the move of hurricane : (1) Eulerian evolution of f is equal to 0 = 0 βv (2) (1) + (2) ⇨ (3) ⇨ The eulerian evolution of ζr give the move of the hurricane
5.6.4 Forecasting of hurricanes :Move of hurricane : effect of the basic current Budget of • Firstly, the move of hurricane is given by the basic • current, which advects the relative vorticity ζr • Some studies have shown that this budget explains • 30 to 80% of the variance of the move of hurricane under • 24 to 72 h forecasting (depends on latitude, size of the • hurricane) • under climatological winds, we can explain climatological • track of hurricanes (generally, westwards move since • easterlies occur throughout atmosphere under tropics) Source : Neumann, 93
5.6.4 Forecasting of hurricanes :Move of hurricane Budget of : the Rossby’s β - effect Analyse the evolution of ζrwith this only budget : North Pole y 1. Northen Hemisphere • β = ∂ f/ ∂ y >0 • westward to the cyclone, • v<0 , whence – βv >0 • ⇨ cyclonic circulation produces cyclonic • vorticity westwards and anticyclonic • vorticity eastwards Eq. x = hurricane y x Eq. 2. Southern Hemisphere • β = ∂ f/ ∂ y <0 • westward to the cyclone, • v>0 , whence – βv >0 • ⇨ idem northern hemisphere
5.6.4 Forecasting of hurricanes :Move of hurricane Budget of : the Rossby’s β - effect ⇨ The Rossby’s β – effect, without basic current, move hurricanes westwards for both hemisphere ⇨ This effect accelerate the generally westwards move of hurricane because of easterlies basic current
= hurricane 5.6.4 Forecasting of hurricanes :Move of hurricane • The Rossby’s drift : • The linear β – effect provides a secondary circulation in • the environment which drifts the cyclonic vortex in the • polewards direction Northern Hemisphere North ζr <0 ζr> 0 x ⇨ In northern hemisphere, without basic current, the combined effect of the Rossby’s β - effectand the Rossby’s drift move the hurricanes Northwestwards ⇨ In Southern hemisphere, hurricane move Southwestwards
5.6.4 Forecasting of hurricanes :Move of hurricane Influence of the Rossby’s drift on the track : • The speed of the Rossby’s drift is dependent on the intensity and the extension of the vortex. More precisely, the poleward drift increase with the angular momentum rV⍬. • This process explains why at the mature and powerful stage, the hurricane is more rapidly poleward drifted than at its early stage. • In addition, most of hurricane end their track into mid- latitudes and the hot core is little by little modified into extra-tropical cyclones (associated with violent and complicated phenomenon) • To sum up, for a good tracking of the hurricane, first of • all, it’s very important to forecast its intensity
5.6.4 Forecasting of hurricanes :Move of hurricane Influence of the synoptic environment on the track : • When a hurricane approaches a through, it’s very • difficult to forecast the inflexion point of the track • Effet Fujiwhara : when 2 vortex are very close (less than • 1500 km), they are attracted to each other and turn one • around the other one
5.6.4 Forecasting of hurricanes : Move of hurricane Storm surge Favorable synoptic conditions Unfavorable synoptic conditions Interannual variability Technical forecasting Sommaire hurricane sommaire
5.6.4 Hurricanes : Storm surges • When a tropical cyclone hits the coast (phenomenon called • Landfall), there occurs a rise of sea-level and rush of sea • water inland. This inland-moving water is sometimes the • cause of devastating damage to coastal property and also • Loss of life along the coast. • The following factors may operate together : • Inverted barometer effect, called pressure surge : • the sea level rises by about 1 m for such pressure • defect of 100 hPa Source :from Chris Landsea and NOAA website http://www.aoml.noaa.gov/hrd/tcfaq/C1.html
5.6.4 Hurricanes : Storm surges • 2. Wind-driven surge : cumulative effects of fetch of water • and general coastal shelf • The sustained wind stress due to sustained strong winds • pushes the sea water . This water moves towards the coast in that • sector in which the winds are on-shore and away from the coast in • that sector in which winds are off-shore • In the northern (southern) hemisphere, the on-shore movement • of the sea water is in the right (left) hand sector of the cyclone. • Due to the coastal shelf, the on-rushing water encouters diminishing • depth (gravity wave in shallow water) as it moves from the open sea • to the coast line. • ⇨This leads to tremendous rise of sea level by about 6 to 10 m • in the right hand sector also call ‘dangerous mid-circle’ Northern hemisphere Source : Mayençon R., 1982
⇨Sustained wind in the right hand sector of hurricane 5.6.4 Hurricanes : Storm surges ‘the dangerous mid-circle ‘: another effect is important ! An example to understand : = observed wind = speed of the vortex = 20kt = wind in the relative reference of the hurricane = 70 kt • =70+ 20= 90 Kt Northern hemisphere E W • =70 - 20= 50 Kt
5.6.4 Forecasting of hurricanes : Move of hurricane Storm surge Favorable synoptic conditions Unfavorable synoptic conditions Interannual variability Technical forecasting Sommaire hurricane sommaire
5.6.4 Forecasting of hurricanes :Favorable synoptic conditions Reminder : most of tropical cyclones are initated near the ITCZ Case 1 : Wind surge over North Indian Ocean : • This favorable synoptic condition occur in december- • january-february when the winter monsoon over • Iran/Arabia generates over North Indian Ocean increase • of pressure in lower layer (1 to 2 hPa) • The wind surge increase the gradient pressure and the flow • on the northen flank of the ITCZ and generates horizontal • shear and finally produces relative vorticity • This seed of relative vorticity can generate a tropical cyclone • several days after in the winter hemisphere under • favorable SST December to february Surface condition a Source : F. Beucher, Météo-France ITCZ A
5.6.4 Forecasting of hurricanes :Favorable synoptic conditions Case 2 : Increase of trades over South Indian Ocean • A northwards shift or intensification of the South Indian • Ocean high increases in turn trades on the southern • flank of the ITCZ • Following an increase of horizontal shear and production • of relative vorticity which is favorable to initiate a tropical • cyclone over South Indian Ocean December to february Surface condition ITCZ increased trades A Source : F. Beucher, Météo-France
5.6.4 Forecasting of hurricanes :Favorable synoptic conditions Case 3 : Outflow in upper troposphere • The upper outflow is a convenient way to thrust away the • mass and to fall down the pressure inward a hurricane. • Without this upper outflow, the strong upward motion along • the eyewall would vanished and the hurricane would die • Generally, the upper circulation is organized into 1 or 2 • powerful outflow branches : • Example 1 : sometimes, the proximity of the subtropical jet • (STJ) is a favorable synoptic condition to organize the • outflow. • Example 2 : in the southern hemisphere, the 2 outflow • branches are favourably located Northwestwards and • Southeastward the cyclone in connection with STJ and TEJ December to february 200 hPa TEJ H Source : F. Beucher, Météo-France STJ
5.6.4 Forecasting of hurricanes : Move of hurricane Storm surge Favorable synoptic conditions Unfavorable synoptic conditions Interannual variability Technical forecasting Sommaire hurricane sommaire
5.6.4 Forecasting of hurricanes :Unfavorable synoptic conditions • Which consequences of the landing of hurricanes ? • Increased value of surface roughness parameter (friction forces) may cause even intensification of the low-level inflow and intensity of the hurricane. • At long-term, the eyewall is destroyed because the upper part of the cyclone go much faster than the lower part. • Cuts-off of moisture supply (enthalpy energy) results at long-term of the weakening of the hurricane.
5.6.4 Forecasting of hurricanes :Unfavorable synoptic conditions • Over seas • Except over Kuroshio current or Gulf Stream, poleward of 20° latitude, the SST are too cold to supply enough enthalpy energy (latent and sensible heat) to maintain the intensity of a hurricane • - When the vertical shear is too large ( >12 m/s between surface and upper tropo), the eyewall is too much tilted and the interactions between the surface and upper troposphere are destroyed. • - In addition, when the vertical shear is large, the mass ventilation is too fast to allow concentration and accumulation of heat and is thus not leading to a drop • in surface pressure . • - Besides, a large vertical shear is favorable to dry intrusion which kills or prevents initiation of hurricanes.
5.6.4 Forecasting of hurricanes :Unfavorable synoptic conditions • What is the Saharian Air Layer (SAL) ? • How does it affect hurricane ? • The SAL is a massive sandstorm blowing off NW Africa • desert during late spring, summer, and early fall. • The SAL can cross the Atlantic, and many times as far as • Carribean • . The SAL extends between 1500-6000m, is associated with • dry air (50 % less moisture than a typical tropical sounding), • and strong wind (20-50 kt). • . The SAL have a negative impact on tropical cyclone • frequency and intensity : vertical shear and dry air have • negative impact while the impact of the dust is not yet • clearly established (a priori stop the intensification ?) • . The increase of frequency of SAL are also linked with • problem of pollution and decline of coral reef over • Carribean
5.6.4 Forecasting of hurricanes :Unfavorable synoptic conditions • Detection of the SAL (GOES 12) • IR satellite • Visible satellite 3.4.2 :monsoon
5.6.4 Forecasting of hurricanes :Unfavorable synoptic conditions Impact of the SAL (yellow to red color) on Erin Source : Dunion, 2004 : reduced intensity
5.6.4 Forecasting of hurricanes : Move of hurricane Storm surge Favorable synoptic conditions Unfavorable synoptic conditions Interannual variability Technical forecasting Sommaire hurricane sommaire
5.6.4 Forecasting of hurricanes :Interannual variability : El Nino • Reminder : EL Nino (EN) is characterized by significant • changes in SST anomalies through alterations in sea level • pressure anomalies, trades winds, and convection. • During EN event, strong upper level westerly shear occur • Over Atlantic, and as a result development of hurricanes are capped. • But overall, during EN, we observe far less hurricanes, especially at low latitudes Impact of El nino on observed tropical storm frequency : Sources : d’après Gray 84a, Chan 85, Dong 88, Lander 94
5.6.4 Forecasting of hurricanes :Interannual variability : El Nino • Over Atlantic, EN event favors more troughs in the subtropics whence increased occurrence of hurricanes at high latitudes and decreased occurrence at low latitudes. Impact of El nino on observed tropical storm location : Sources : d’après Gray 84a, Chan 85, Dong 88, Lander 94
5.6.4 Forecasting of hurricanes :Interannual variability : QBO (west) Reminder : the Quasi Biennal Oscillation (QBO) is a periodic variation in the direction of stratospheric wind (west phase and east phase) across the deep tropics. The QBO causes alterations in upper level vertical wind shear. It influences frequency and intensity of hurricanes. Impact of westerly phase of QBO on observed tropical storm frequency : Sources : d’après Hastenrath et Wendland 79, Shapiro 82, Gray 84a
5.6.4 Forecasting of hurricanes :Interannual variability : QBO (west) • During the westerly phase of QBO, increase intensity of • hurricanes overall Impact of westerly phase of QBO on observed tropical storm intensity : Sources : d’après Hastenrath et Wendland 79, Shapiro 82, Gray 84a retour 4.2.2: QBO
5.6.4 Forecasting of hurricanes : Move of hurricane Storm surge Favorable synoptic conditions Unfavorable synoptic conditions Interannual variability Technical forecasting Sommaire hurricane sommaire
5.6.4 Technical forecasting • Until the advent of satellites, to judge the intensity of the vortex out in the sea, the analyse relied only on ships reports and the analyst’s experience with regional climatology of storms and hurricanes • Even at present, aircraft reconnaissance is the most dependable technique of knowing the intensity of the vortex but this system is very expensive and not many meteorological services can afford it • Coastal radar are also useful but they are generally effective within a range of about 300 km but this tool don’t leave enough time for local authorities to take precautionary measures
5.6.4 Technical forecastingSatellite pictures • ‘Dvorak technique’ • Finally, forecaster fall back upon visible and IR satellite pictures as a practical source of information to judge the intensity of a tropical cyclonic vortex. • But, first of all, the satellite pictures must be calibrated by a dependable reference system which is the aircraft reconnaissance ; because of the cost only USA and Caribbean use this technique, called ‘Dvorak technique’ (1975). • The ‘Dvorak technique’ use the difference between the temperature of the warm eye and the surrounding cold cloud tops. The larger the difference, the more intense the tropical cyclone is estimated to be. • This technique furnishes a reliable forecast for the intensity of the cyclonic vortex until 24 h. • But aware ! ! maximum wind speed based upon ‘Dvorak technique’ alone are prone to some error since wind is not solely a function of pressure gradient (in gradient wind balance, the radius also contributes to the speed’s wind)
5.6.4 Technical forecasting Models A variety of hurricane track forecast models are run operationally for Atlantic and Northeastern Pacific. Example of result of these models : track_Ivan 1. Climatological and persistence models : the basic model, called CLIPER (CLImatology and PERsitence), is a multiple regression statistical model that best utilizes the persistence of the current motion and also incorporates climatological track information (Alberson, 1998). Surprisingly, CLIPER was difficult to beat with numerical model forecast until the 1980s. 2. Statistical-dynamical models : A statistico-dynamical model, issued by the national Hurricane Center of Miami, the NHC90 (McAdie 1991) uses geopotential height predictors from the Aviation model to produce a track forecast 4 times per day. The primary synoptic time NHC90 forecasts (00 and 12 UTC) are based upon 12h old Aviation runs. An update to this model was implemented in 1998 (NHC98)
5.6.4 Technical forecastingModels 3. Numerical models : i. The Beta and Advection Model (BAM) follows a trajectory with vertically-averaged horizontal winds and a correction that accounts for the beta effect (marks 1992). Three versions (shallow layer, middle, deep) has been run 4 times per day since 1990. ii. A nested barotropic hurricane track forecast model (VICBAR) has been run 4 times per day since 1990. It uses run from current NCEP analyses (Alberson and Demaria 1994) iii. The NCEP Aviation and MRF models (Lord 1993) used for track forecasting since 1992. These are global models. iv. A triply-nested movable mesh primitive equation model developped at Geophysical Fluid Dynamics Laboratory (Bender et al 1993) , known as GFDL model has provided forecasts since 1992. v. The UKMET’s global model utilized for track of tropical cylones around the world (Radford 1994). Sommaire hurricane Chap.6
Chan, J. C. L., 1985 : ‘Tropical cyclone activity in the Northwest Pacific in relation to El Nino/Southern Oscillation phenomenon. Mon. Wea. Rev., Vol.113, p.599-606 • Christopher Landsea, NOAA AOML/ Hurricane Research Division, 4301, Rickenbacker causeway, Miami, Florida 33149. email : landsea@aoml.noaa.gov • Dong K., 1988 : ‘El Nino and tropical cyclone frequency in the Australain region and the Northwest Pacific. Aust. Met. Mag., Vol.36, p.219-225 • Dunion, J.P., and C.S. Velden, 2004 :’ The impact of the Saharan Air Layer on Atlantic tropical cyclone activity. Bull. Amer. Meteor. Soc., Vol.85, n°3, p. 353-365 • - Gray, W. M., 1984a :’Atlantic seasonal hurricane frequency : Part I. El Nino and 30 mb quasi-biennial oscillation influences. Mon. Wea. Rev., Vol.112, p. 1649-1668 • Hastenrath, S. and W. Wendland, 1979 :’On the secular variation of storms in the tropical North Atlantic and Eastern Pacific’. Tellus, Vol.31, p.28-38 • Lander, M., 1994 :’An exploratory analysis of the relationship between tropical storm formation in the western North Pacific and ENSO’. Mon Wea. Rev., Vol.122, p. 636-651 • - Mayençon R., 1982,1992 : Météorologie Marine, Editions maritimes et d’Outre-mer, Rennes, • 335p. • Neumann, C. J., 1993 :’Global Overview’. Chapter 1, Global Guide to Tropical Cyclone Forecasting, WMO:TC-N°560, Report N0 TCP-31, World Meteorological Organization, Geneva. • Shapiro, L. J. , 1982 :’Hurricane climatic fluctuations, part 1 : patterns and cycles’. Mon Wea. Rev., Vol. 110, p.1007-1013 References