Hurricanes: Development, Structure, and Impact
Explore the formation, structure, and movement of hurricanes. Learn about damages, warning systems, and naming conventions associated with these powerful tropical cyclones.

Hurricanes: Development, Structure, and Impact
E N D
Presentation Transcript
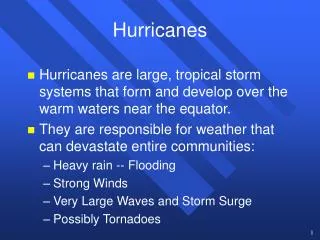
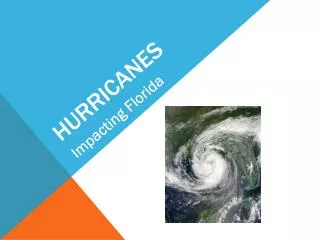
Hurricanes • This chapter discusses: • Tropical cyclone and hurricane development, structure, and movement • Hurricane damages, warning systems, and naming conventions
Tropical Weather & Waves Tropical winds typically blow from the east, and when they encounter a slow moving trough of low pressure, called a tropical wave, the winds initially converge and lift to produce showers and thunderstorms. Figure 16.1
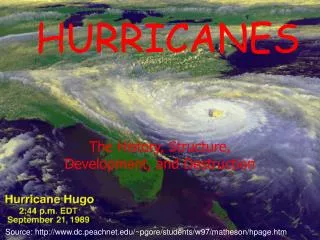
Structure of a Hurricane Tropical cyclones are the international name of hurricanes, which typically form from an organized mass of storms which formed along a tropical wave. In this image of Hurricane Elena, the central area of broken clouds is the eye, surrounded by an eye wall cloud and spiral rain bands, with a total diameter nearing 500 kilometers. Figure 16.2
Hurricane Wind Profile Figure 16.3 The low pressure core of the hurricane is surrounded by several thunderstorms, each with updraft and downdraft cycles. The wind and moisture cycle is repeated as: surface moist air converges in a counterclockwise pattern at the eye, rises to create high pressure aloft, condenses, precipitates, dries, diverges outward in a clockwise pattern, sinks, and warms.
3-D Radar Image of Hurricane Figure 16.4 Several key features of a hurricane are shown in this radar composite image, including overshooting clouds, the area of strongest echoes (heaviest rain), and the eyewall.
Formation by Organized Convection Figure 16.5A Figure 16.5B One theory explains that hurricane formation requires cold air above an organized mass of thunderstorms, where the release of latent heat warms the upper troposphere, creates high pressure aloft, which pushes air outward and causes a low to deepen at the surface. Air moving toward this low intensifies the cycle.
Formation by Heat Engine Another theory of hurricane development proposes that a heat engine cycle, fueled by warm moist input air and the release of heat when it converts to cool dry air. Differences in the input and output temperatures determine the amount of work on the ocean and winds that is performed.
Hurricane Stages of Development The initial components of a hurricane may form as a tropical disturbance, grow into a tropical depression when winds exceed 20 knots, become a tropical storm when winds exceed 35 knots, and finally then qualify as a hurricane when winds exceed 64 knots. Figure 16.6
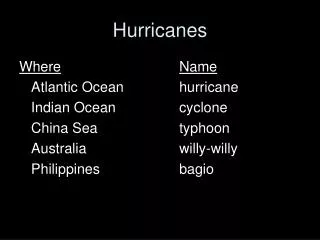
Hurricane Movement Global patterns of tropical cyclone formation and movement have been recorded on this figure, which notes regional names for these systems. Travel speeds for the hurricane my range from 10 to 50 knots, but they may also stall over a region and cause destructive flooding. Figure 16.7
Erratic Paths of Hurricanes Figure 16.8
Historical charts of hurricane location may reveal erratic, and hard to predict, patterns of movement. As this figure shows, hurricanes may occasionally double back. Further, when removed from the ocean and without a moisture source to supply energy, they may still continue an inland journey. In the North Atlantic, on average 3 storms per year move inland and bring damaging winds and rain.
North Atlantic Hurricanes Composite infrared imagery of Hurricane Georges reveals the pattern of a seasonal threat for Central and North America coastlines. Tropical cyclones at the same latitude survive longer in the Atlantic than Pacific Ocean because of warmer Atlantic Ocean waters. Figure 16.9
Hurricane Damage & Warning Figure 16.11 Figure 16.10 Hurricanes have their highest wind speeds on the side where storm pushing winds amplify cyclonic, or counterclockwise, rotational winds. In coastal areas, flooding is aggravated by the hurricane low pressure triggering higher tides and Ekman transport piling up water.
Hurricane Watch & Warning Figure 16.5A The National Hurricane Center in Florida issues a hurricane watch 24 to 48 hours before a threatening storm arrives, and if it appears that the storm will strike within 24 hours, a hurricane warning is issued. While some consider the warning area too large, causing unneeded evacuation, such evacuations have saved many lives. Hurricane Hugo, with peak winds near 174 knots, caused tremendous damage.
Hurricane Saffir-Simpson Winds Figure 16.14 Figure 16.13A In 1989 Hugo caused nearly $7 billion in damages in the U.S., killing 49 in the Caribbean and United States. Current classification of hurricanes is based on their wind speed, however, and not on human or property damage. Hurricanes range from category 1 to 5, with winds of 64 to more than 135 knots.
Hurricane Names and Cost Category 5 Hurricane Andrew (1992) was the costliest US storm, but it ranks as less intense than 1935 and 1969 hurricanes. Hurricane names are chosen from an alphabetical list of male and female names for the Atlantic and Pacific, some of which are retired if the storm was especially damaging. Figure 16.14
Hurricane Paloma • Reached category 4 strength (145 mph) • Struck the Cayman Islands and Cuba • Retired because: • Third most powerful November hurricane on record in the Atlantic Basin • $154 million in damages to Cayman Islands, $300 million in Cuba • Replaced with Paulette
Hurricane Luis • Reached category 4 strength (140 mph) • Was one of four simultaneous systems in the Atlantic (Humberto, Iris, Karen) • Retired because: • Hit most of the Leeward Islands as a category 4 • caused catastrophic damage, especially in Antigua, Barbuda, St. Barthelemy, St Martin and Anguilla (~$3 billion) • Spawned a 98’ wave that hit the QE2 (largest wave ever recorded, though Ivan may have created a 130’ wave) • Replaced with Lorenzo
How names are Retired • Each country participating in the WMO counsel can request a name be retired if the storm affected them • Usually requested if it does significant damage or is related to high fatalities • Full counsel votes on whether the storm name is retired
How new names are added • Any retired name must be replaced with the same gender name • Any retired name must be replaced with same “nationality” name • If name was Spanish, the Spanish countries pick three new names and the full counsel votes on the replacement name • U.S. will ask for Sandy to be retired and propose replacement names
Hurricane Andrew Devastation in Homestead, Florida August 24, 1992 Figure 16.15
Likelihood for Landfall Between 1900 and 1999, only two category 5 hurricanes have made landfall along the Gulf or Atlantic. Numerous category 1, and less damaging storms, that do make landfall may not cause much damage, but bring needed rainfall. Figure 16.16