Download
1 / 23
230 likes | 355 Views
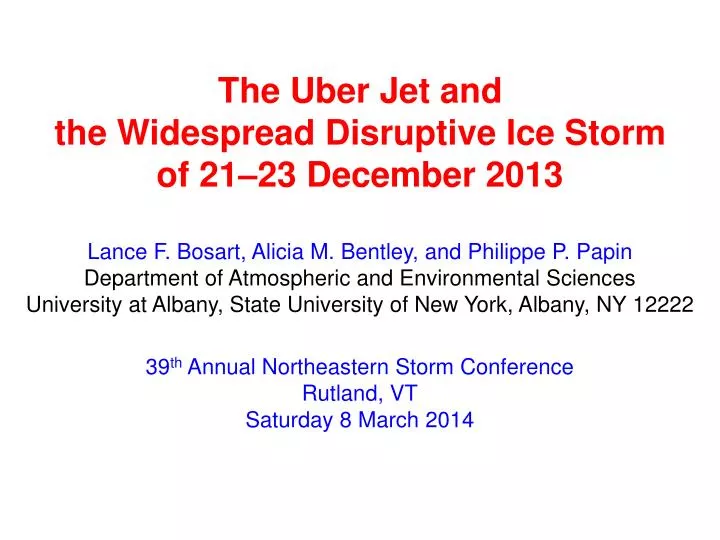
The Uber Jet and the Widespread Disruptive Ice Storm o f 21–23 December 2013 Lance F. Bosart, Alicia M. Bentley, and Philippe P. Papin Department of Atmospheric and Environmental Sciences University at Albany, State University of New York, Albany, NY 12222

E N D
The Uber Jet and the Widespread Disruptive Ice Storm of 21–23 December 2013 Lance F. Bosart, Alicia M. Bentley, and Philippe P. PapinDepartment of Atmospheric and Environmental Sciences University at Albany, State University of New York, Albany, NY 12222 39th Annual Northeastern Storm ConferenceRutland, VT Saturday 8 March 2014
200-hPa maximum wind speed (m s−1) 0.5° Climate Forecast System Reanalysis: 1979–2013 Source: Dr. Ryan Maue
1200 UTC 22 December 2013 250-hPa wind speed (shaded, m s−1), geopotential height (black contours, dam), and temperature (red dashed contours, °C)
0000 UTC 22 December 2013 Detroit, MIWilmington, OH
0000 UTC 22 December 2013 Pittsburgh, PA Buffalo, NY
1200 UTC 22 December 2013 Albany, NY Upton, NY
0000 UTC 23 December 2013 Gray, ME Chatham, MA
Histogram of 250-hPa maximum wind speed NCEP–NCAR Reanalysis: 1979–2012 Domain: 40°–60°N and 90°–60°W 4000 3500 3000 2500 2000 1500 1000 500 0 Occurrences (1979–2012) 20 30 40 50 60 70 80 90 100 110 250-hPa Wind Speed (m s−1) Source: Dr. Jason Cordeira
−60 −48 −36 −24 −12 0 12 24 36 48 Source: Dr. Mel Shapiro
600 480 360 240 120 0 −120 −240 −360 −480 Source: Dr. Mel Shapiro
KLAN – Lansing, MI CYYZ – Toronto, ON 240 h backward trajectories ending at:0000 UTC 22 December 2013 240 h backward trajectories ending at:0600 UTC 22 December 2013 Source: NOAA HYSPLIT MODEL
KART – Watertown, NY KBTV – Burlington, VT 240 h backward trajectories ending at:0600 UTC 22 December 2013 240 h backward trajectories ending at:1200 UTC 22 December 2013 Source: NOAA HYSPLIT MODEL
KMLT – Millinocket, ME CZDB – Debert, NS 240 h backward trajectories ending at:1200 UTC 22 December 2013 240 h backward trajectories ending at:1800 UTC 22 December 2013 Source: NOAA HYSPLIT MODEL
KCLE – Cleveland, OH KCLE – Cleveland, OH 120 h backward trajectories ending at:0000 UTC 22 December 2013 72 h forward trajectories starting at:0000 UTC 22 December 2013 Source: NOAA HYSPLIT MODEL
CYYZ – Toronto, ON CYYZ – Toronto, ON 120 h backward trajectories ending at:0000 UTC 22 December 2013 72 h forward trajectories starting at:0000 UTC 22 December 2013 Source: NOAA HYSPLIT MODEL
CYUL – Montreal, QC CYUL – Montreal, QC 120 h backward trajectories ending at:0000 UTC 22 December 2013 72 h forward trajectories starting at:0000 UTC 22 December 2013 Source: NOAA HYSPLIT MODEL
CYSC – Sherbrooke, QC CYSC – Sherbrooke, QC 120 h backward trajectories ending at:1200 UTC 22 December 2013 72 h forward trajectories starting at:1200 UTC 22 December 2013 Source: NOAA HYSPLIT MODEL