Tableau Training in Bangalore
160 likes | 403 Views
Tableau Institutes : kelly technologies is the best Tableau Training Institutes in Bangalore. Providing Tableau training by real time faculty in Bangalore.

Tableau Training in Bangalore
E N D
Presentation Transcript
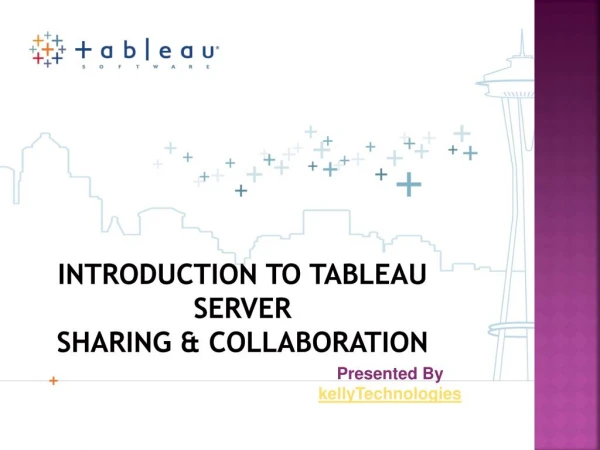
Introduction to Tableau ServerSharing & Collaboration Presented By kellyTechnologies
Tableau Server Share Discover Participate http://www.kellytechno.com
Share | Discover | Participate Understanding data is not only for a few experts • A library of visual results • The place to publish • Share findings with the group • No more isolated desktops • Analytic templates • Retrieve and re-purpose • Centralize data models http://www.kellytechno.com
Tableau Professional Tableau Server Web Browser publishes to and imports from the server interacts with server content http://www.kellytechno.com • Server Basics
Share| Discover | Participate Discover what others are discovering Just browsing… “What has Teri been working on?” http://www.kellytechno.com
Share| Discover | Participate Search becomes part of the discovery process • More than a fast way to locate something • Search includes the data elements used in the analysis “Where is that tech sector analysis I saw last week?” “What type of analysis of the industry sectors have others performed?” http://www.kellytechno.com
Share| Discover | Participate Unlock the data analyst inside everyone • Bring data to life • Filtering, drilling, sorting, paging, and inspecting data values • Explore with live data http://www.kellytechno.com
Share| Discover | Participate Diversity increases the quality of the wisdom Discussion enhances understanding The community evolves how content is organized by using tags http://www.kellytechno.com
Tableau Server Share Discover Participate http://www.kellytechno.com
Web users didn’t build the view, they need your guidance • Web users… • can’t see the shelves • didn’t write the calculations, create the bins or groups • only filter on what you show them • won’t know what other filters you’ve set • Make your interpretation of the data clear by… • having clear names, titles, annotations & comments • linking thoughts & views together http://www.kellytechno.com • Author’s, keep in mind
Sheet 1 • Does the view have a clear title and caption? • Are the legends shown? • Does it have quick filters? • Are axes labeled with measures and units? • Is the formatting clean and simple? • Would an annotation help identify a key point? • Would a link to a related view provide context or more depth of analysis? • Have you overloaded a dashboard? • Does it look beautiful on a laptop? • Consider adding “director’s cut” text as a comment or annotation http://www.kellytechno.com • Authoring Checklist
THANK YOU Presented By KellyTechnologies