Download

1 / 5
50 likes | 85 Views
Tableau Training Institute |Sathya Technologies is the Best Tableau Training in Hyderabad Offers Tableau Training by Real time Experts & Material.

E N D
Mail us:-sathyainhyd@gmail.comCall Us:-040-65538958, 65538968, 65538978. TABLEAU COURSE CONTENT Business Domains and Information Technology Introduction to Business Domains Information Technology and Business Data and Business Data Warehouse Concepts Introduction to Data Warehouse Characteristics of Data Warehouse Facts and Dimensions Difference between OLTP and OLAP Architecture of Data Warehouse Various Data Warehouse tools The Data, Tables, Database and SQL Introduction to Data and Importance Introduction to Tables and Database Introduction to SQL SQL for Tableau Developers
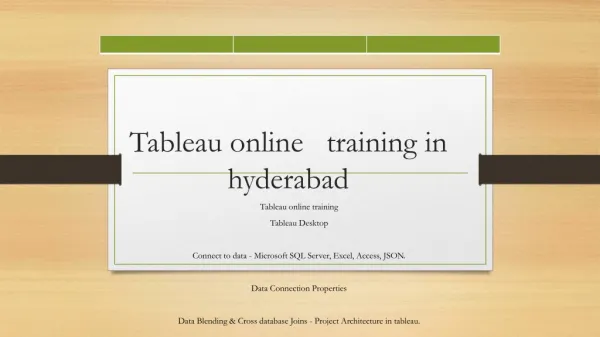
Business Intelligence (BI) Concepts • Introduction to Business Intelligence The importance of Business Intelligence The relation between BI and DW • Tools and Technologies in BI are • TABLEAU DESKTOP • Tableau introduction • Tableau Architecture • Tableau introduction and overview • Workbook, Stories, Dashboards and Worksheets Data Sources and Data Connection Types • Filters and Sort • Define filters – Filter on Measures and Dimension, Global filters, Context filters. Define filtering at source. • Explain sort. • Graphs/Maps/Charts • Define bar charts and line charts. Define individual, blended and dual axis. Define filled maps and symbol maps. Define heat maps and tree maps • Define pie charts. Define Gantt charts.
Sets and Groups • Define Groups • Define Sets • Join Data using Sets • Calculated Fields • Introduction to Calculated Fields Define Table Calculations Define Date Calculations • Define String Calculations • Define Logical Functions • Define Aggregation and De-aggregation • Data presentation and analysis • Define Forecasting, Trend Lines, Reference Lines Define Drop lines, Annotation • Define Summary card • Actions • Explain Actions • Actions using – Filter, Highlight and URL • Dashboards • Explain dashboards • How to create a dashboard Explain Dashboard formatting Actions in Dashboards
Data Blending and Data Refresh • Define Data blending Define Data Refresh Explain joins • Performance aspects of Data Refresh • Report Migration Process • Introduction to Environments • Report Migration Check-list • Source Data and Data Refresh Needs • TABLEAU SERVER • Tableau Server Administration (Concepts) • Publishing, Scheduling and Sharing Security, Authentication and Access Roles and Responsibilities • Performance Monitoring and Tracking • Tableau Server Advanced Administration (Concepts) • High Availability • Backup and Recovery
TABLEAU – R – INTEGRATION • Tableau – R – Integration (Concepts) • How to Integrate R using Tableau Server Tableau Server Role in Integration • R output as Input to Tableau • File Based Integration of R with Tableau • TABLEAU LIVE PROJECTS and CASE STUDIES • LIVE PROJECT 1: Tableau as BI reporting tool in INSURANCE Domain • Overview of Insurance Business • Insurance and Information Technology • Insurance dependency on Business Intelligence and Data Warehouse • Tableau as BI reporting tool in Insurance Domain • LIVE PROJECT 2: Tableau as BI reporting tool in BANKING Domain • Overview of Banking Business • Banking and Information Technology • Banking dependency on Business Intelligence and Data Warehouse • Tableau as BI reporting tool in Banking Domain • LIVE PROJECT 3: Tableau as BI reporting tool in RETAIL Domain • Overview of Retail Business • Retail Industry and Information Technology • Retail Industry dependency on Business Intelligence and Data