Download

1 / 10
220 likes | 331 Views
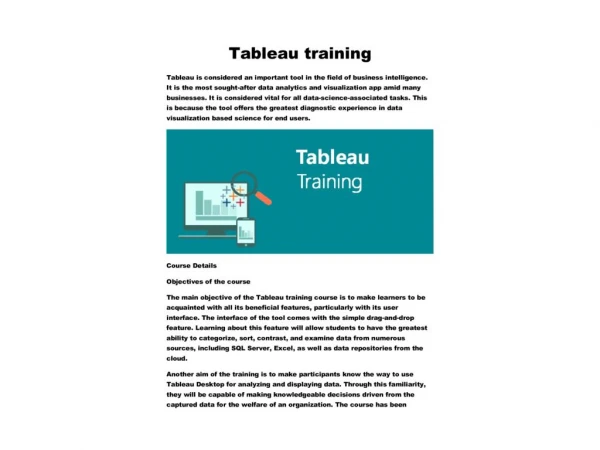
Tableau is a popular business intelligence tool provided by the Tableau Software. Data analysis is very fast with Tableau and the visualizations are created in the form of dashboards and worksheets. Users can create and distribute an interactive and shareable dashboard, which describes the trends, variations, and density of the data in the form of graphs and charts. That’s why we can say Tableau is a key player in the business intelligence field. So, Learn Tableau from Industry Experts

E N D
Tableau is a popular business intelligence tool provided by the Tableau Software. Data analysis is very fast with Tableau and the visualizations are created in the form of dashboards and worksheets. Users can create and distribute an interactive and shareable dashboard, which describes the trends, variations, and density of the data in the form of graphs and charts. That’s why we can say Tableau is a key player in the business intelligence field. So, Learn Tableau from Industry Experts. Global Online Trainings offers the Best Tableau Training from the past 5 years. We are having more than 10+yr experience expert trainers. We are providing a real-time and job oriented training program in Tableau. Our Tableau Online Training offers deep understanding of fundamentals and practical usage of technology.
❖Tableau is a powerful business intelligence and data visualization tool that has a very clear user interface. You do not need any coding knowledge to work with the Tableau. It is very useful in drilling-down data, creating insight reports and Garner actionable business ideas. ❖For the fifth year in a row in 2017, Tableau business intelligence and data visualization tool has been placed in the leader’s quadrant in Business Intelligence and Analytics Platforms by IT research firm Gartner. Gartner has positioned Tableau as top in ability toexecute again thisyear. ❖When it comes to the aspects of intuitive analytics and interactive visual analytics there is no better than Tableau. Tableau has both Desktop and Online versions, which enablesaccess to softwaredata in thecloud oron premises. ❖Before you get started Tableau Online Training, you must know about what exactly mean by “Business intelligence and Data Visualization tool” when we talk about tableau.
Business Intelligence (BI) refers to all technologies, applications and practices for the collection, integration, analysis and presentation of business information. The purpose of business intelligence is to make a good business decision. Specifically, Business Intelligence Systems are Data- based Decision Support Systems (DSS). Sometimes Business Intelligence is interchangeably with briefing books, report and query tools and executive information systems. Data visualization means the graphical representation of information and data. By using visual elements like pie charts, graphs, and maps, data visualization tools provide an accessible way to see and understand trends, outliers, and patterns in data. In Big Data world, data visualization tools and technologies are essential to analyze massive amounts of information and make data-driven decisions.
Tableau Software provides the best analytical experience for end user based on data visualization science. It is also identified as leader in analytical software. Tableau allows users to move quickly through data and ask many questions in a number of ways. Technological advances have more prevalent and enhanced data visualization than ever before, also increasing the importance of business intelligence. Here are some reasons as why Tableau is one of the best business intelligence and business analytics tools: ➢Speed in the Market ➢Tableau Does any data like Big Data, Hadoop, Teradata, Excel, Google Analytics, SAP etc ➢Stunning, Interactive Visualizations ➢Compatibility across the Multiple Platforms ➢Working with Tableau Dashboard and Reporting Tool ➢Self-Service business intelligence and analytics
❖Excellent Data Visualizations: ❖Easy Up-gradation & No hidden Cost ❖Excellent Customer Service ❖Easyanalysisof big data ❖User-friendlyapproach ❖Integration & Mobile Support
❖Scheduling or notification of reports ❖No Custom Visual Imports ❖Custom formatting in Tableau ❖Static and singlevalue parameters ❖Screen Resolution on Tableau Dashboards
Tableau Desktop is a data visualization software that allows you to view and understand data in minutes. Anybodycan work with Tableau Desktop. The Tableau Server is another product of the Tableau. Tableau server gives some out of the box analysis on the usage and performance of the product. From the Tableau stables that lets you distribute your interactive workbooks to the right stakeholders. Tableau Online is the analytics platform that is available in the cloud and accessible through any device anywhere. It is useful to publish the Tableau Dashboards on the Tableau Online and share the data innovations anyone with
Today, Tableau is one of the top business intelligence and data visualization tools that are available in the marketing. Fortunately there are nearly 500 companies are using Tableau Software in order to derive valuable insights from their data. The best part of Tableau is that there is no require for the people working with the powerful tool to have any sort of technical knowledge or programming skills. Most of the features of Tableau are self-explanatory and drag-and-drop aspects. So all businesses need to be more valuable with their insights to ever grow their business, a tool like tableau becomes that much more indispensable to organizations regardlessof the industry vertical and customersegmentation. At Global Online Trainings, learn how to use Tableau to see and understand your business data better. Tableau is a one of the best key player in the business intelligence field. This Tableau tutorial will help you to use this program to analyze and visualize yourorganization’s data.