Download

1 / 19
190 likes | 296 Views
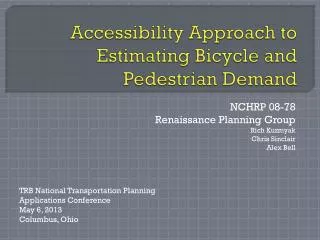
Accessibility Approach to Estimating Bicycle and Pedestrian Demand. NCHRP 08-78 Renaissance Planning Group Rich Kuzmyak Chris Sinclair Alex Bell. TRB National Transportation Planning Applications Conference May 6, 2013 Columbus, Ohio. Outline. Research context

E N D
Accessibility Approach to Estimating Bicycle and Pedestrian Demand NCHRP 08-78 Renaissance Planning Group Rich Kuzmyak Chris Sinclair Alex Bell TRB National Transportation Planning Applications Conference May 6, 2013 Columbus, Ohio
Outline Research context Basics of the accessibility approach Summary of research findings Application Next steps
Research Context • NCHRP 8-78: Estimating Bicycle and Pedestrian Demand • Create new methods – sensitive to land use and facilities • Product: Practitioner Guidebook of scalable techniques • Tour-based models (Seattle – Bradley & Bowman) • Enhanced 4-step (Seattle – Kockelman & Kahn) • Accessibility approach (Arlington VA)
Basics of the Accessibility Approach • Travel behavior is responsive to “accessibility” • Mode choice can be linked to: • Amount of activity reachable from an origin over corresponding modal network • Account for impedance unique to mode (directness, slope, facility type, etc.)
Basics of the Accessibility Approach • Use detailed travel networks to model travel times from a given origin to all accessible destinations (by mode): • Walk • Bike • Transit • Auto • NAVTEQ streets, GTFS transit schedules, bicycle facilities and trails
Summary of Research Findings • Non-motorized trip making is associated with high accessibility scores, regardless of mode • Modal competiveness (in terms of accessibility) influences mode choice • More transit trips are made to destinations that have high walk and transit accessibility scores • Discretionary walk trips are highly sensitive to walk accessibility at the trip origin • Walk to work a unique/limited opportunity
Summary of Research Findings Walk accessibility alone influences mode choice
Spreadsheet Application Spreadsheet tool (beta version and template for additional tools)
Application • Models effects of… • Land use changes • Development master plans • Disaggregated TAZ forecasts • Future land use scenarios • Network enhancements • Accessibility benefits of improving street connectivity • Non-motorized facilities
Application • Data and process • Microzone residential and employment activity • Person trip generation • Zone to zone walk skims (microzones) • Walk accessibility score • Output • Microzone walk trip generation • Matrix of walk microzone to microzone walk trip interchange
Next Steps • Develop native GIS tool • Community Viz or other scenario planning platform • Enable dynamic spatial analysis • Evaluate and operationalize relationships among modal accessibilities and socio-demographics • High local walk access, low regional transit access vs. High local walk access, high regional transit access • Household and individual characteristics
Next Steps Incorporate into NCHRP Guidebook Integrate with regional travel demand model Incorporate EPA’s Smart Location Database modal accessibilities and add geoprocessing services to support rapid deployment of the tool
Questions Thanks!