Download
1 / 18
180 likes | 378 Views
Pedestrian and Bicycle Issues Richmond, CA. Richmond Bicycle & Pedestrian Advisory Committee (RBPAC) June 2, 2008. Why walk and bicycle?. Physical Activity/Health Transportation Enjoyment. Walk and bicycle trips, National household travel survey results, 1990, 1995, and 2001.

E N D
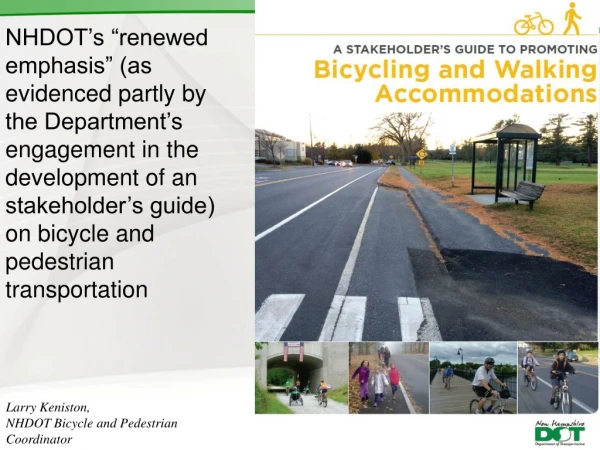
Pedestrian and Bicycle Issues Richmond, CA Richmond Bicycle & Pedestrian Advisory Committee (RBPAC) June 2, 2008
Why walk and bicycle? • Physical Activity/Health • Transportation • Enjoyment
Walk and bicycle trips, National household travel survey results,1990, 1995, and 2001
Richmond Pedestrian Collisions 2002-05257 collisions – facts and factors • Drivers not yielding to peds in crosswalks • Pedestrians not in intersection or crosswalk • Drivers not obeying traffic signs and signals • 46% of the victims were African-American, almost 60% were female • 1/4 were 13-17 year olds • Most injuries occur in the afternoon and evening hours (Noon-9:59 PM)
Five Priority “Hot Spots” • 23rd St. between Bissell and Grant, 19th to 27th • 23rd St. near Richmond High • Between Nevin and Macdonald, 33rd to 41st • Between Barrett and Chanslor, 1st to 7th • Cutting, between Carlson and S. 41st
Before PEDS During PEDS 2004 2005 2006 2007 Age 0-15 13 13 3 4 16+ 30 33 10 16 Total 43 46 13 20 Richmond Pedestrian Injuries 2004-07 For several years, Richmond had one of the highest rates of pedestrian injury for CA cities of its size
Bicycle Injuries 2001 to 2007Total: 158 Collisions – top causes • Bicyclist on Wrong Side of Road (51) • Auto Right of Way Violations (28) • Traffic Signs and Signals (18) • Improper Turning (17)
Bike Collision Hot Spots • Macdonald – from 1st to 24th; 37th to 45th • 23rd Street, between Rheem and Cutting • Cutting, between 22nd and 41st Streets • Barrett, between 6th and 8th St; and between 36th Street, Rt. 80 and Key Boulevard • 13th Street, between Rheem and Esmond • Carlson at Rt. 80 and San Luis Street
Similarities Travel slower than vehicles Vulnerable to traffic, weather,and pollution Are unlicensed Include a range of ages, abilities, and disabilities Differences Bicycles can travel faster and farther Pedestrians slower, can change direction quickly, and frequently stop Bicyclists ride on roadway and follow vehicle rules Pedestrians require sidewalks Contrasting Bicycles and Pedestrians
Pedestrian Engineering Principles • Buffer between cars and walkers • Wide sidewalks, at least 6 feet • Create visibility of/for pedestrian • Shorten Crossing Distance • Lengthen Crossing Time • Attractive, useful destinations • Action : Create Pedestrian Districts
Bicycle Engineering Principles • Bike-compatible traffic calming • Bike-permeable barriers • Site distances to opposing traffic • Wide lanes to prevent “dooring” • Action: Create a network of designated on/off street bikeways
Presentation by Nancy Baer, MSWProgram ManagerContra Costa Health Services Funding for this project provided by the CA Kids’ Plate program