Download
1 / 28
280 likes | 405 Views
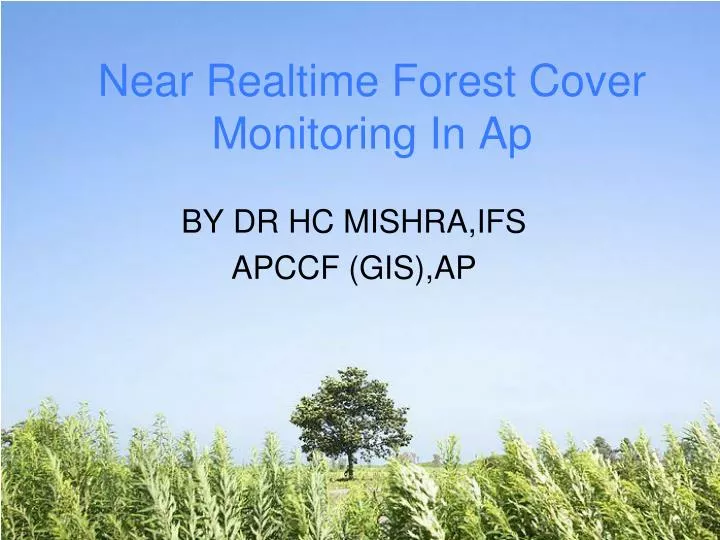
Near Realtime Forest Cover Monitoring In Ap. BY DR HC MISHRA,IFS APCCF (GIS),AP. INTRODUCTION.

E N D
Near Realtime Forest Cover Monitoring In Ap BY DR HC MISHRA,IFS APCCF (GIS),AP
INTRODUCTION • Andhra Pradesh is the fourth largest state in India geographical area wise with an area of 2,75,045 square Kilometers. Number of Forest Blocks in Andhra Pradesh State is about 3500. Total area of Reserved forest in Andhra Pradesh is 6381.43 km2. • Andhra Pradesh lies between latitudes of 120 37’ and 190 55’N and longitudes of 760 45’ and 840 46’E in the south east coast of the country. • Geographically the Andhra Pradesh state has a hilly region in the Eastern Ghats along coast apart from hilly tracts of Nallamallais and Erramallais in Rayalseema, a plain region in the coast and plateau in the Telengana region with an average height of 100 to 1000 meters over MSL. • Godavari and Krishna are the two principal rivers flowing from west to east in the Andhra Pradesh state. • Southwest monsoon is the principal monsoon in the Andhra Pradesh state though north east monsoon also causes rainfall in November – December in Nellore , Chittoor and Cuddapah districts. The average rainfall in the Andhra Pradesh state is 800 – 1200 mm.
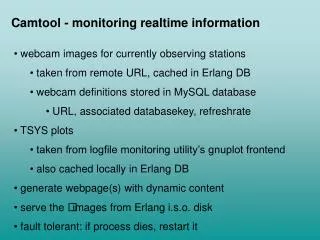
New Methodology in 2007 Satellite data download Geometrical rectification Radiometric Normalization SOI toposheets 1:50,000 scale Masking out non- forest areas NDVI Transformation Making sub-sets of scene Ground reference data Preparation of change map by Erdas matrix tool and by comparing 2007 and 2008 FCCs visually Density slicing Editing Accuracy Assessment Post classification correction Over lay boundaries Ground truthing Area statistics Maps
Before Normalization After Normalization IRS P6 LISS III 29th October 2008 Imagery Normalized with respect to IRS P6 LISS III 22nd December 2007Imagery
Change Matrix of Khammam District 2007(22-12-07) and 2008(29-10-2008) (IRS P6 LISS III 102-60 Imagery) 2007 2008
Accuracy Matrix of 2007 Classification Accuracy percentage is 84.63
RESULTS AND ANALYSIS • Total change points found in the state between 2007 and 2008 are 1167. • Total net change is –107 km2 during 2007-2008. Positive change is • 753 Hectares & negative change is 115 km2. • Epicentre of -ve change is Khammam, where the net change is -5852 Ha. • Second circle with maximum destructions is Rajahmundry with -2250 Ha. • Ananthapur with -13 Ha has lowest negative change. • The –ve change in VSS areas is -3298 Hectares. Many VSS have cut down • their own areas and some their adjacent areas. • 7.In wildlife areas –ve change is -191 Hectares. • 8.Paloncha forest division showed maximum negative change in the state of about -2200hacteres.
Limitations of Technology • Since resolution of data from Liss-III is 23.5m, smaller areas below 0.5 hectare cannot be captured. • Young plantations and species having less chlorophyII content in their crown, do not give proper reflectance and as a result correct interpretation of such areas becomes difficult. • Considerable details on ground could be obscured in areas having clouds and shadows. It is difficult to interpret such areas without the help of collateral data. • Variation in spectral response pattern poses problems in interpretation. Chameleon type scenerio of Decidous mixed forests often cheats the interpreter. • Gregarious occurrence of bushy vegetation like Lantana and certain agricultural crops, such as sugarcane, cotton, etc., often pose problems in delineation of forest cover as their spectral response pattern is similar to that of tree canopy.
Nirmal Division Lat:19.077040; Long:78.567450 Comp. No:948 Division: Nirmal An area of 3 ha was converted in to MDF to NF Date of visit-28-10-2009
IRS P6 LISS III Imagery 13-NOV-2007 IRS P6 LISS III Imagery 07-NOV-2008
IRS P6 LISS III Imagery 13-NOV-2007 IRS P6 LISS III Imagery 07-NOV-2008
KARIMNAGAR EAST Latitude :18.603625 Longitude:79.819952 6.7 haof area converted from Open to NF Comp.No:296 Division: Karim nagar(E) Date of visit: During Dec.2009
SRIKAKULAM 2.5 ha Encroachment at Kadaganti (E) Beat, Longitude: 83.893246 Latitude : 18.601308 Comp.No:151 Division: Srikakulam Date of visit: 1st and 2nd of Dec. 2009
Liss III 14 November 2007 Liss III 08 November 2008 Datum:- Indian Bangladesh
NUZVID RANGE,KRISHNA DIVISION (Compt-123)16.81208N,80.76664E (I-B)
COST BENEFIT ANALYSIS Cost- 1.cost of data-30scenes of LISS III – Rs 200000 2. Manpower in Laboratory- 6 scientist manmonth-(Actual work in realtime as soon as image available)-Rs100000 3.Ground truthing expenses- 2 scientist/FRO manmonth-Rs 100000 4.Report preparation and printing-Rs 100000 -------------------------------------------------------------------------------- Total expenditure-Rs 500000 per annum Benefit- It is priceless.It helps in plnning, protection and convincing Government for more input.It is difficult to quantify it.
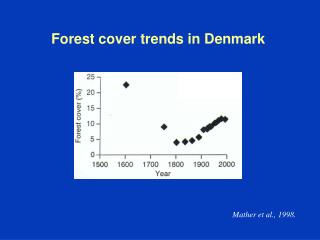
CONCLUSIONS 1.There is decline of forest cover in AP from the year 1999 till 2007 as per FSI reports. As per APFD’s own analysis we find loss of forest cover during 2006-2007,2007-2008 and 2008-2009. 2.The EYE IN THE SKY is highly reliable and gives accurate forest cover changes like deforestation and greenness very reliably. It can not be hidden by anybody. 3.VSS areas, Wild life areas, APFDC areas are not spared by the encroachers. 4. Let us THINK, ACT and not be COMPLACENT.