Download
1 / 1
20 likes | 131 Views
Wear in the runner. Kulekhani Reservoir. Base station With GPS sets. Wear in the guide vanes. Sensor and transmitter box. SMOOTH sampler. SMOOTH sampler. Pressure breaker. Pressure breaker. Sensor and transmitter box. Flow. 12 MW Khimti Power Plant, Nepal.

E N D
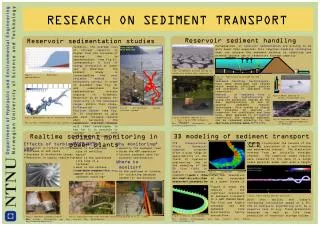
Wear in the runner Kulekhani Reservoir Base station With GPS sets Wear in the guide vanes Sensor and transmitter box SMOOTH sampler SMOOTH sampler Pressure breaker Pressure breaker Sensor and transmitter box Flow 12 MW Khimti Power Plant, Nepal 1500 MW Nathpa Jhakri HPP, India RESEARCH ON SEDIMENT TRANSPORT Reservoir sediment handling Reservoir sedimentation studies Sediment monitoring Consequences of reservoir sedimentation are proving to be more sever than expected. This requires handling strategies that can achieve the sediment balance to stabilize and promote optimum use of reservoirs storage capacity Globally, the average loss of storage capacity is higher than the increase of storage due to sedimentation. (see Fig.1). Consequently, a loss of energy production or water use is observed. The present study is investigating the most reliable method for bathymetry survey, in order to document (see Fig. 2) and understand the sedimentation process ongoing in Kulekhani Reservoir as an example for reservoirs in the Himalayan range. Within this study, Differential Global Position System (see Fig. 3) is considered to give the most reliable results when surveying the reservoir. Further studies will then investigate in how far it is possible to counter act this sedimentation process and to prevent the loss of storage volume. Fig. 1:Sediment problem during dry season but hidden when reservoir is full of water Fig.1: Reservoir sedimentation Fig. 3: Hydrosluicing through the dam intake Sediment handling technologies, have been developed and tested which enables efficient suction and transport of sediment from reservoirs. Removal of sediment from a reservoir by hydrosluicing is using the potential energy at the dam. Hydrosluicing is one of several sediment removal techniques. This system is simple and possible to operate in reservoir for continuous and long time. When applied in irrigation reservoirs the removed sediment can be released directly to the field to improve land fertility. Fig.4: Water jetting to break consolidated clay deposit Fig.3: Differential Global Position Systems Fig.2: Bathymetric map of Kulekhani Reservoir Fig.2: Sediment removal at a test rig at NTNU hydraulic laboratory Fig.5: Sediment removal from a small irrigation reservoir in Ethiopia For further information you may contact Durga Sangroula, durga.sangroula@ntnu.no For further information you may contact Kiflom.Belete, kiflom.belete@ntnu.no 3D modeling of sediment transport using CFD Realtime sediment monitoring in power plants Effects of turbine wear • Motivation • What is the optimum size of settling basin? • What is the guaranteed life time of a turbine? • What is the optimum operation regime of a power plant w.r.t. sediment handling? • Why monitoring? • Quantify the sediment load • Guide the HPP operation • Collect sediment data for economic optimisation Figure 3 illustrates the results of the numerical simulation of a self-forming and meandering channel. The simulation started from an initially straight channel. The numerical model results were compared to the data of a large scale physical model test with a length and width of 40m and 12m, respectively. CFD (Computational Fluid Dynamics)computer programs offer a wide range of applicability in the field of hydraulic engineering. One is the modeling of the 3D flow field in hydro systems, coupled with the calculation of the river bed changes in the vertical and transversal direction. • Reduction in turbine efficiency • Increase in O&M costs • Increase in production losses • Reduction in supply regularity Where to monitor? • At the upstream of turbine for collecting database needed for optimisation • At the headworks to use as early warning system Do we have answers? No, not yet. Fig.1: Suspended sediment concentration Figure 1 illustrates the simulation of the distribution of the suspended sediment concentration at a water intake in an irrigation reservoir. Figure 2 shows the results of the numerical simulation of sediment transport in a 180° channel bend. The flow was highly unsteady and the sediment size distribution fairly non-uniform. Fig.3: Free-forming meander evolution With this ability and today’s increasing calculation speed of a PC, CFD in hydraulic engineering will be a powerful tool in e.g. flood protection measures as well as life time prediction of reservoir storage volume. Fig.2: Transient bed changes Fig.1: Sediment induced turbine wear Fig.2: Installed real-time sediment monitoring system at power plants For further information you may contact Nils Rüther, nils.ruther@ntnu.no For further information you may contact Meg Bishwakarma, meg.bishwakarma@ntnu.no