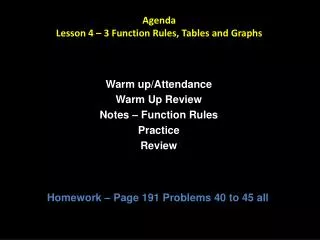
Quantitative Relationship Analysis Agenda
Week agenda includes test review, function table practice, graphing exercises, and application problems. Practice and apply quantitative relationship concepts.

Quantitative Relationship Analysis Agenda
E N D
Presentation Transcript
Function Tables CCSS6.EE.9: Represent and analyze quantitative relationships between dependent and independent variables. Please copy your Agenda for the week. You will get your test back Tuesday. Materials needed today: Journal, pencil, glue, (ruler on Tuesday), highlighter, scissors, Easter candy for your Math teacher!
Vocabulary Flip Chart • Trim out the flip chart to fit in your Journal. Only cut between the word boxes on the top. Glue into Journal.
VOCABULARY A function is a relation that assigns exactly one output value to one input value. The output depends on the input. The function rule describes the relationship between each input and output. You can organize the input-output values and the function rule in a function table. In a function, the input value is also known as the independent variable, since it can be any number you choose. The value of the output depends upon the input value, so the output value is known as the dependent variable.
Instructions: Look at the input value and determine what rule applies to get the output value.
Rule: multiply by 10, 10 • n or 10n
Rule: multiply by 10; 10 • n, or 10n
Try more examples on this website: http://www.studyzone.org/testprep/math4/d/functiontable4l.cfm
Solution: • You can see that you obtain each output • by adding 5 to the input. • Answer: The function rule given by the table is b = a + 5
How can a function table help you find the input or the output? • When data is organized, we can use the function rule and the input to find the output or work backward using the output and the function rule to find the input.
Are they functions?A. B. B. IS NOT A FUNCTION! Why not?
VOCABULARY • The set of all input values is called the domain of a function. The set of all output values is called the range of a function.
Practice what you have learned. • Complete Task Cards 1 – 4. • Due Tuesday.
Tuesday, March 29, 2016 Function Tables CCSS6.EE.9: Represent and analyze quantitative relationships between dependent and independent variables. Today we will practice graphing a function. Materials needed today: Journal, pencil, glue, ruler
Practice graphing a function • Complete the Tasks 5 – 10 neatly in your Math Journal.
Wednesday, March 30, 2016 Function Tables CCSS6.EE.9: Represent and analyze quantitative relationships between dependent and independent variables. Please be ready to check your homework practice. You will check your own. Today we will complete the Functions and Equations WS where we apply what we have learned to contextual problems. This is due Friday. Thursday is the Immigration Simulation. Materials needed today: Journal, red pen, pencil, ruler, glue, highlighter
Application Problem • Write a function rule that converts y years to m months. Use the function to calculate the number of months in 12 years. Create a function table. Then state the domain and the range of the function. • (You can create your own function table. Use your ruler for the table and the graph.)
Did you include all of the required elements of a graph? • Did you give the graph an appropriate title? Years to Months Conversion • Did you identify the horizontal axis as x and the vertical axis as y? • Did you label the x-axis (Years) and y-axis (Months)? • Did you create equal intervals for your scale? • Did you measure equal spacing for the intervals? • Did you plot the ordered pairs accurately? (x, y) • Did you connect your points with a line?
Practice what you have learned. • Complete the Functions and Equations WS. Create all graphs neatly in your Journals. Use rulers for accuracy!! • Due Friday!
Friday, April 1, 2016 Function Tables CCSS6.EE.9: Represent and analyze quantitative relationships between dependent and independent variables. Please be ready to check your homework practice. You will check your own. Then you will complete a problem on graph paper and it will be your “Ticket out the door.” This will be graded like a quiz score so do a good job. You may use your Journal notes! You may not use your neighbors!! Materials needed today: Journal, red pen, pencil, ruler
Ticket Out the Door • Isaiah is buying jelly beans. In bulk, they cost $3 per pound, and a candy dish costs $2. The function rule, t = 3x + 2 where x is the number of pounds, can be used to find the total cost (t) of x pounds of jelly beans and 1 dish. • Make a table that shows the total cost of buying 2, 3, or 4 pounds of jelly beans and 1 dish. • Graph the function. Use your checklist to be sure you have included all of the elements of a graph. • Check to see that your name is on your paper!
The End. Great Job!