
Uploaded by
kaz
6 SLIDES
238 VIEWS
60LIKES
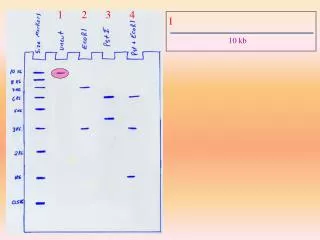
1 kb
DESCRIPTION
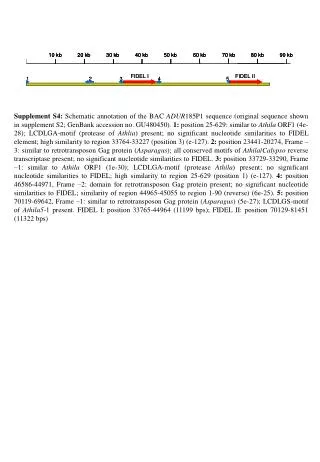
M. 1. 2. 1 kb. Fig. S1. C F10 F9 F12b. Fig. S2. B. A. F10. Control. EGC. Cat. EC. EC. EGC. F9. F12b. C. D. EGC. Cat. Cat. EGC. EC. EC. Fig. S3. Na + /K + ratio. Fig. S4. NBT. DAB. A. E. Control. F3H. Control. F3H. untreated. 50mM. B. F.
Download
1 / 6
Download Presentation 
1 kb
An Image/Link below is provided (as is) to download presentation
Download Policy: Content on the Website is provided to you AS IS for your information and personal use and may not be sold / licensed / shared on other websites without getting consent from its author.
Content is provided to you AS IS for your information and personal use only.
Download presentation by click this link.
While downloading, if for some reason you are not able to download a presentation, the publisher may have deleted the file from their server.
During download, if you can't get a presentation, the file might be deleted by the publisher.
E N D
Presentation Transcript
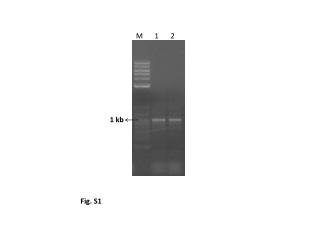
M 1 2 1 kb Fig. S1
C F10 F9 F12b Fig. S2
B A F10 Control EGC Cat EC EC EGC F9 F12b C D EGC Cat Cat EGC EC EC Fig. S3
Na+/K+ ratio Fig. S4
NBT DAB A E Control F3H Control F3H untreated 50mM B F 150mM 200mM G C H D Fig. S5
PME activity (%) Fig. S6

More Related