Download
1 / 4
50 likes | 209 Views
This study explores the measurement of personal growth attributed to multicultural education using the Posttraumatic Growth Inventory (PTGI). By assessing positive psychological changes over a designated time period, we demonstrate how multicultural education contributes significantly to personal growth across various dimensions—including appreciation of life, new possibilities, and relationships. Self-reported data from 108 students reveal crucial insights into academic and non-academic experiences, highlighting the transformative impact of multicultural education on individual growth across different academic years.

E N D
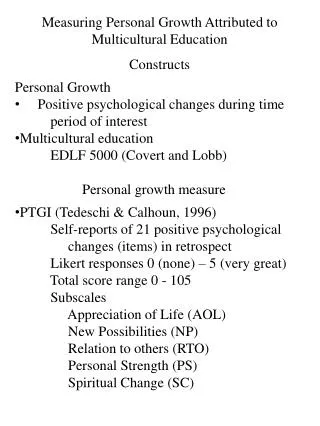
Measuring Personal Growth Attributed to Multicultural Education Constructs Personal Growth Positive psychological changes during time period of interest Multicultural education EDLF 5000 (Covert and Lobb) Personal growth measure PTGI (Tedeschi & Calhoun, 1996) Self-reports of 21 positive psychological changes (items) in retrospect Likert responses 0 (none) – 5 (very great) Total score range 0 - 105 Subscales Appreciation of Life (AOL) New Possibilities (NP) Relation to others (RTO) Personal Strength (PS) Spiritual Change (SC)
Measuring Personal Growth Attributed to Multicultural Education PTGI (Tedeschi & Calhoun, 1996) Application of PTGI Response scale None 0 ----- 1 ----- 2 ----- 3 ----- 4 ----- 5 Very great Example items ___2. Appreciation of value of my own life (AOL) ___3. Developed new interests. (NP) ___8. Sense of closeness with others (RTO) Exercise: Personal growth during last semester Total = ___ + ___ + ___ = ____ x 7 = ______ 1 3 8 Sub Comparison groups Range of 13 trauma studies = 40 – 80 units UVa semester = 59.07 (SD 15.77, N 347) 60.42 (SD 16.61, N 117) 63.58 (SD 16.32, N 154)
Contributions to Personal Growth (N =154) • Multicultural Education class 34.97 (19.86) percent • All other academic experiences 23.28 (14.93) • Subtotal academic experiences 58.25 (23.63) percent • Subtotal non-academic experiences 41.75 (23.63) • Total growth=100.00 percent
Student percentage attributions of yearly growth in retrospect to academicand non-academic experiences by year (N = 108 students) Academic Non-academic Total _______ _______ _______ Year m % SD % m % SD % m % SD % Freshman 8.83 7.63 15.59 9.22 24.35 11.72 Sophomore 7.13 4.33 10.37 6.43 17.50 7.66 Junior 11.52 7.74 15.29 10.10 26.85 10.13 Senior 11.11 7.74 20.23 10.28 31.30 10.49 Total 38.59 14.81 61.41 14.81 100.00 ----