Download
1 / 9
90 likes | 157 Views
Demand Side Economics For The Pacific Liner Trades. Presented by Doug Coates Principal, Manalytics International. The Society of Naval Architects and Marine Engineers. Shippers and Consignees are Driving the Growth of Trade in the Transpacific.

E N D
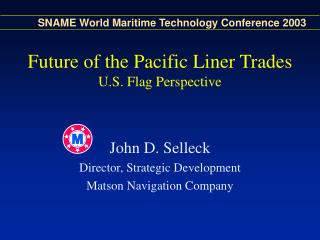
Demand Side Economics For The Pacific Liner Trades Presented by Doug Coates Principal, Manalytics International The Society of Naval Architects and Marine Engineers
Shippers and Consignees are Driving the Growth of Trade in the Transpacific • Global sourcing and global market penetration tend to be irreversible • Supply chain decisions and awareness have risen to the Board level • Supply chain variables are many, quantification is key • Logistics solutions involve issues and opportunities such as: • Order cycle improvement • Inventory management including distribution center by-pass and JIT • Modal selection based on profitability impact • Postponement, merge-in-transit and other complex solutions • The importance of timely information and IT visibility
Strong Forecast Growth in Eastbound Transpacific Trade: CAGR 5.2% 2002-2007 • Drivers of Forecast • Growth in US Real GDP • 3%+ from 2004 through 2007 • US Dollar Exchange Rates • Generally strengthen through early 2004 and then weaken through 2007 • US Industrial Production • Steadily increases through forecast period • Industry Sourcing Patterns • Notably China • Ratio of Inventories to Sales • Steadily declines through forecast period • US Interest Rates • Projected to rise through early 2006 and then stabilize
Rapid Expansion in China Sourcing; Is It Sustainable? • Drivers • Low cost labor • Quality gains • Improving infrastructure • Favorable fixed exchange rate (Undervalued RMB v US dollar) • Trade agreements - WTO • Risks • China political stability • China economic stability • RMB revaluation • Competition (e.g. India) • US dependency on China • Trade barriers (e.g. Quotas to protect US textile sector)
Healthy Forecast Growth in Westbound Transpacific Trade: CAGR 5.3% 2002-2007 • Drivers of Forecast • Growth in Asian Real GDP • 3.9% through 2007 • Stronger growth in Northeast Asia (notably China and South Korea) than Southeast Asia • Global Economic Recovery • Stimulates Asian demand for imports of industrial inputs and capital equipment • Trade Agreements and WTO • Supports Chinese demand for agricultural products (meat, fruit, etc.) • Currency Movements • Potential revaluation of Chinese RMB would stimulate exports to China
Transpacific Trade Imbalance Will Create Greater Equipment Management Challenges for Shipping Lines • Ratio of Eastbound to Westbound Trade will be stable at 2.5:1 • However, the absolute imbalance will continue to grow • 1993: 1.5 million more TEU moving Eastbound than Westbound • 2002: 5.0 million • 2007f: 6.5 million • Challenges • Empty container repositioning costs • Storage of empty containers • Vessel utilization westbound
Transpacific Vessel Size; Where are the Limits? 8,063 TEU “OOCL Long Beach” Maiden Voyage July 2003; now deployed in Europe-Asia trade lane 47.5 feet (14.5 meters) draft and 17 containers across • Drivers • Trade Volume • Economies of Scale • Vessel Size • 1980s ~ 4,000 TEU • 1990s ~ 6,000 TEU • Today ~ 8,000 TEU (Europe-Asia) • Future ~ 10-12,000 TEU ? • Risks • Economies of Scale Diminish • Pressure on Terminal and Inland Infrastructure / Performance
Is High Speed Transpacific Ocean Service Viable? • Drivers • Today service choice is restricted to slow / cheap ocean service and fast / expensive air service • Some shippers would be attracted to fast / medium priced ocean service that offers faster ocean transit time and shorter total door-to-door cycle time • Potential High Speed Service • 40-50 Knots Vessel Service Speed • Limited Port Coverage • High Speed Terminal Operations • Risks • Financial • Technological “Middle Market”
Thank You Manalytics International A transportation and logistics consulting firm headquartered in San Francisco Active on projects for a range of clients including shippers, container shipping lines, equipment suppliers, IT providers, investment banks Contact Details: Doug Coates, Principal dcoates@manalytics.net Tel: 415 777 3500 Fax: 415 777 0540 www.manalytics.net