A Methodology for Developing Urban Sustainability Indicators in Andalusía
380 likes | 510 Views
This work presents a structured methodology for developing synthetic urban sustainability indicators based on weak and strong sustainability principles for 18 municipalities in Andalusia. It outlines a four-step process: determining individual weights for indicators, aggregating preferences from a panel of experts, identifying and determining the indicators, and finally aggregating results. By addressing the complexities of environmental, urban development, demographic, and economic indicators, the scheme aims to establish a meaningful and comparable framework for measuring sustainability.

A Methodology for Developing Urban Sustainability Indicators in Andalusía
E N D
Presentation Transcript
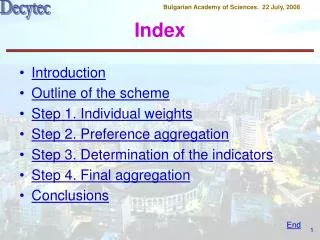
Index • Introduction • Outline of the scheme • Step 1. Individual weights • Step 2. Preference aggregation • Step 3. Determination of the indicators • Step 4. Final aggregation • Conclusions End
Introduction • Sustainable development (Brundtland Commision, 1987): development that meets the needs of the present without compromising the ability of future generations to meet their own needs. • This is, by nature, a multicriteria concept.
Sustainability Introduction Social Economic Environmental
Introduction Natural capital vs. Man-made capital. • Weak sustainability. Total capital constant. Substitutability paradigm. • Strong sustainability. Natural capital and man-made capital are (at the most) complementary. Non substitutability paradigm.
Introduction • Life cycle assesment. Environmental performance of production and services through all phases of their life cycle (from craddle to tomb): Extracting and processing raw materials; manufacturing; transportation and distribution; use, reuse and maintainance; recycling; final disposal. How to measure sustainability?
Introduction • Ecological footprint. Estimate of the ammount of land area a human population, given prevailing technology, would need if the current resource consumption and pollution by the population is matched by the sustainable (renewable) resource production and waste asimilation by such a land area. How to measure sustainability?
Introduction • (Urban) Indicators. A set of magnitudes measuring different concrete aspects of sustainability. Over 200 indicators are presently used. • Still to be done: • To define a full common framework (meningful and comparable), • To actually measure them, • To develop synthetic urban sustainability indicators. How to measure sustainability?
Introduction • ... define a methodology, based on the reference point approach, to develop a pair of urban synthetic sustainability indicators (weak and strong) for a set of municipalities of Andalucía, based on a pre-defined set of indicators. In this work, we...
Municipalities • Indicators • Criteria • Experts Data selection 0 Determination of individual weights 1 Haldi (1995) Preference aggregation Meta-Goal Programming Rodríguez et al. (2000) 2 Synthetic indicators within each class Reference Point Wierzbicki (1986) 3 Final aggregation 4 Strong and Weak Indicator Outline of the scheme
Outline of the scheme • Municipalities. 18 (M) Andalusian municipalities, over 55,000 inhabitants. • Indicators. 4 classes: • Environmental (13) • Urban development (12) • Demographic (16) • Economic (22) (I - number of indicators in a given class)
Outline of the scheme • Criteria. The indicators are to be maximized or minimized • Some are clear (e.g. % of water loss) • Others are not so clear (e.g. Paper containers/inhabitant, electricity consumption) • Panel of experts. 6 experts (ND): • 2 Environmental • 2 Social • 2 Economic
1. Individual Weights Each expert k (k = 1, ..., ND) assigns weights to the indicators in the following way: • Assume a class of indicators is chosen, which contains I indicators. • The expert classifies the indicators into L sets (VI, CI, I, NVI, NI is suggested)
l + 1 1 0.75 alk set l 0.5 0.25 0 l - 1 1. Individual Weights • For each l = 2,..., L-1, the expert is asked to place set l between sets l-1 and l+1.
1. Individual Weights • The following system of equations is solved: • The weights are assigned:
1. Individual Weights • Weights for the environmental class:
2. Preference Aggregation • We establish the following set of goals: • The achievement function takes the form:
(AP1) d*, smax 2. Preference Aggregation • Best maximum deviation:
(AP2) s*, dmax 2. Preference Aggregation • Best total deviation:
2. Preference Aggregation • Pay-off matrix: • Meta-Goals: we choose values
2. Preference Aggregation • Meta-Goal Programming Problem:
2. Preference Aggregation • An auxiliary problem is solved. • The process can continue until we achieve a satisfactory solution. • The final result gives the group weights for each class of indicators.
2. Preference Aggregation • Group weights for the environmental class:
2. Preference Aggregation • Group weights for the environmental class:
3. Determination of Indicators • For a given class of indicators, is the value of indicator i for municipality j
3. Determination of Indicators • Aspiration and reservation levels:
2 1 0 -1 3. Determination of Indicators • Individual achievement functions:
3. Determination of Indicators • Construction of the synthetic indicators (wi are the normalized group weigths)
3. Determination of Indicators • Graphical representation:
4. Final aggregation • Let us denote by the strong and weak indicators corresponding to municipality j and to the indicator class h (h = 1, 2, 3, 4) • Let us assume that the weights are assigned to the four classes of indicators
4. Final aggregation • Global indicators: • Weights: • Environmental: 0.4 • Economic: 0.3 • Urban development: 0.15 • Demographic: 0.15
4. Final aggregation • Graphical representation:
4. Final aggregation • Weights: two options • Give the weights ourselves and carry out a sensitivity analysis. • Determine the weights in a group decision making process like the one carried out in step 2
Conclusions • Urban indicators have been designed to measure concrete aspects of sustainability, but there is a lack of a unified measure. • We have developed a full methodology to build synthetic urban indicators. • Both strong and weak sustainability indicators are built and taken into account. • The pair of indicators and their graphical representation allows a more in depth analysis of the data.
Conclusions • The methodology developed comprises several different schemes, among which we can point out: • Meta-Goal Programming, for the determination of the group weights. • Reference point technique (objective ranking) for the construction of the indicators. • The scheme can be adapted to any number of indicators and/or municipalities.
Conclusions • Future Research Lines: • To carry out a wider study: • Broader range (national?), higher number of municipalities. • Refine the panel of experts. • More reliable data. • Final aggregation: • Full systematic sensitivity analysis. • Classification scheme.
Conclusions • Future Research Lines: • Group weights: • Full group decision making process. • Different penalizations for n and p. • Reference point scheme: • Interval criteria. • Different slopes for the branches of the achievement functions. • Different aspiration and reservation values.