Enhancing Educational Outcomes: Springfield Schools and Quantum Growth Partnership Collaboration
This presentation outlines the collaboration between Springfield public schools and the Quantum Growth Partnership (Q5) focused on improving educational outcomes through the Gallup Student Poll. The poll measures crucial factors such as hope, engagement, and wellbeing—key predictors of students' success. Stakeholder engagement is emphasized, involving parents, teachers, and local businesses in a community-wide initiative. By integrating polling data and professional development, the aim is to enhance students' educational experiences and future opportunities.

Enhancing Educational Outcomes: Springfield Schools and Quantum Growth Partnership Collaboration
E N D
Presentation Transcript
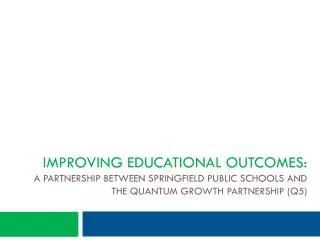
Improving educational outcomes:A partnership between Springfield public schools and the quantum growth partnership (Q5)
Presentation Overview • Education & Economic Development • The Poll • Engaged Stakeholders
Gallup Student Poll Overview The Gallup Student Poll is a 20-item measure of • Hope • Engagement • Wellbeing Why Measure? • Proven relationship to educational outcomes • Malleable feelings • Not currently measured on a large scale
Gallup Student Poll Overview Hope The ideas and energy we have for the future • More robust predictor of college success than are high school GPA, SAT, and ACT scores
Gallup Student Poll Overview EngagementThe involvement in and enthusiasm for school • Engagement impacts school performance
Gallup Student Poll Overview WellbeingHow we think about and experience our lives • Predictor for future success
Gallup Student Poll Overview Q03. There is an adult in my life who cares about my future. (Hope) Q07. I know I will find a good job after I graduate. (Hope) Q08. I have a best friend at school. (Engagement) Q10. My teachers make me feel my schoolwork is important. (Engagement) Q15. Were you treated with respect all day yesterday? (Wellbeing) Q20. If you are in trouble, do you have family or friends you can count on to help whenever you need them? (Wellbeing)
Gallup Student Poll Overview • Poll administered on-line at school • 10 minute duration • ~3 week polling period in October • Cost underwritten by Gallup • Results provided ~3 weeks • Results managed by school district
Fall 2011 GSP Highlights • 326,426 students polled in grades five through twelve • Total completes for the Gallup Student Poll (5 administrations): 1,039,657* • 1,185 schools from 129 school districts in 31 states • 626 elementary schools • 353 middle schools • 206 high schools *Gallup has not polled over 1 million students since many students have participated multiple times.
Gallup Student Poll Overview • Stakeholders – A Community Wide Focus • Parents & Caregivers • Teachers & Administrators • Businesses • Residents
Gallup Student Poll Overview • Chamber’s Investment: • Support Gallup Student Poll Implementation • Connect Stakeholders to Students to Impact Hope, Engagement & Wellbeing • Promote Professional Development for Stakeholders • Annual Poll Data to Provide Feedback to Stakeholders
Gallup Student Poll Overview Questions?