Analyzing Blood Sugar Levels and Diabetes Through Graphing Practice
This practice exercise involves creating double line graphs to study blood sugar levels and their relation to diabetes. Participants will learn to construct graphs with appropriate scales, titles, labels, and keys. They will analyze how insulin production affects sugar breakdown and identify glucose levels over time. The activity includes questions about the experimental design, such as identifying control and experimental groups, and assessing the effectiveness of Jolt Cola and muscle cream based on the provided data.

Analyzing Blood Sugar Levels and Diabetes Through Graphing Practice
E N D
Presentation Transcript
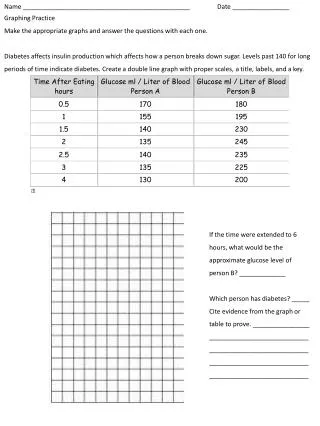
Name _______________________________________________ Date ________________ Graphing Practice Make the appropriate graphs and answer the questions with each one. Diabetes affects insulin production which affects how a person breaks down sugar. Levels past 140 for long periods of time indicate diabetes. Create a double line graph with proper scales, a title, labels, and a key. If the time were extended to 6 hours, what would be the approximate glucose level of person B?_____________ Which person has diabetes? _____ Cite evidence from the graph or table to prove. ________________ ________________________________________________________________________________________________________________
(Double bar graph) Independent variable: ____________________________ Dependent variable:____________________________ Control group: ____________________________ ____________________________ Experimental group: ____________________________ ____________________________ Does Jolt Cola work? ___________ Use evidence from the graph and table to explain why or why not. ____________________________ ____________________________ ____________________________ ____________________________
(Double line graph) Independent variable: ____________________________ Dependent variable:____________________________ Control group: ____________________________ Experimental group: ____________________________ Does muscle cream work? ______ Use evidence from the graph and table to explain why or why not. ____________________________ ____________________________ ____________________________ ____________________________