Download
1 / 27
270 likes | 302 Views
This study generalizes the Sequential Probability Ratio Test (SPRT) to include stochastic deadlines, showing the impact of deadline variance on response urgency. The results extend to the general case with convex continuation cost.

E N D
Sequential Hypothesis Testing under Stochastic Deadlines Peter Frazier, Angela Yu Princeton University TexPoint fonts used in EMF. Read the TexPoint manual before you delete this box.: AAAAAAAAA
Sequential Hypothesis Testing
under Stochastic Deadlines
Peter Frazier & Angela Yu Princeton University
Summary • We consider the sequential hypothesis testing problem and generalize the sequential probability ratio test (SPRT) to the case with stochastic deadlines. • This causes reaction times for correct responses to be faster than for errors, as seen in behavioral studies.
Both decreasing the deadline’s mean and increasing its variance causes more response urgency. • Results extend to the general case with convex continuation cost.
Sequential Hypothesis Testing wait wait A B A B A B At each time, the subject decides whether to act (A or B), or collect more information. This requires balancing speed vs. accuracy.
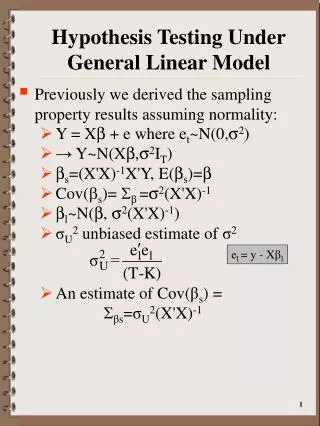
We observe a sequence of i.i.d. samples x1,x2,... from some density. • The underlying density is unknown, but is known to equal either f0 or f1. • We begin with a prior belief about whether f0 or f1 is the true density, which we update through time based on the samples. • We want to maximize accuracy
Let be the index of the true distribution. • Let p0 be the initial belief, P{=1}. • Let pt := P{=1 | x1,...,xt}. • Let c be a cost paid per-sample. • Let d be a cost paid to violate the deadline (used later) • Let be time-index of the last sample collected. • Let be the guessed hypothesis.
Posterior probabilities may be calculated via Bayes Rule: Probability (pt) Time (t)
Objective Function The objective function is: Probability of Error Time Delay Penalty where we require that the decisions and are “non-anticipative”, that is, whether <= t is entirely determined by the samples x1,...,xt, and is entirely determined by the samples x1,...,x.
Optimal Policy (SPRT) Wald & Wolfowitz (1948) showed that the optimal policy is to stop as soon as p exits an interval [A,B], and to choose the hypothesis that appears more likely at this time. A Probability (pt) B Time (t) This policy is called the Sequential Probability Ratio Test or SPRT.
A classic sequential hypothesis testing task is detecting coherent motion in random dots. • One hypothesis is that monkeys and people behave optimally and according to the SPRT.
Broadly speaking, the model based on the classic SPRT fits experimental behavior well. Accuracy vs. Coherence Reaction Time vs. Coherence (Roitman & Shadlen, 2002) There is one caveat, however…
RT Distributions • SPRT fails to predict the difference in response time distributions between correct and error responses. • Correct responses are more rapid in experiments. • SPRT predicts they should be identically distributed. Accuracy Mean RT (Data from Roitman & Shadlen, 2002; analysis from Ditterich, 2007)
Monkeys occasionally abort trials without responding, but it is always better to guess than to abort under the assumed objective function. (Data from Roitman & Shadlen, 2002) (Analysis from Ditterich, 2006) To explain the discrepancy, we hypothesize a limit on the length of time that monkeys can fixate the target.
Objective Function Hypothesizing a decision deadline D leads to a new objective function: Deadline Penalty Time Penalty Error Penalty We will assume that D has a non-decreasing failure rate, i.e. P{D=t+1 | D>t} is non-decreasing in t. This assumption is met by deterministic, normal, gamma, and exponential deadlines, and others.
Optimal Policy The resulting optimal policy is to stop as soon as pt exits a region that narrows with time. Generalized SPRT Probability (pt) Classic SPRT Deadline Time (t)
Response Times Under this policy, correct responses are generally faster than error responses. Correct Responses Error Responses Frequency of Occurrence Reaction Time
Influence of the Parameters Deadline Uncertainty Deadline Mean Deadline Penalty Time Penalty Plots of the continuation regionCt (blue), and the probability of a correct responseP{=|=t} (red). D was gamma distributed, and the default settings were c=.001, d=2, mean(D)=40, std(D)=1. In each plot we varied one while keeping the others fixed.
Theorem: The continuation region at time t for the optimal policy, Ct, is either empty or a closed interval, and it shrinks with time (Ct+1µCt). Proposition: If P{D<1} = 1 then there exists a T < 1 such that CT = ;. That is, the optimal reaction time is bounded above by T.
ProofSketch Define Q(t,pt) to be the conditional loss given pt of continuing once from time t and then behaving optimally. Lemma 1: The continuation cost of the optimal policy, Q(t,p), is concave as a function of p. Lemmas 2 and 3: Wasting a time period incurs an opportunity cost in addition to its immediate cost c. Lemma 4: If we are certain which hypothesis is correct (p=0 or p=1), then the optimal policy is to stop as soon as possible. Its value is:
Proof Sketch Expected Loss Q(t+1,p)-c Q(t,p) min(p,1-p) 1 0 p Ct+1 Ct
References • Anderson, T W (1960). Ann. Math. Statist. 31: 165-97. • Bogacz, R et al. (2006). Pyschol. Rev.113: 700-65. • Ditterich, J (2006). Neural Netw.19(8):981-1012. • Luce, R D (1986). Response Times: Their Role in Inferring Elementary Mental Org. Oxford Univ. Press. • Mozer et al (2004). Proc. Twenty Sixth Annual Conference of the Cognitive Science Society. 981-86. • Poor, H V (1994). An Introduction to Signal Detection and Estimation. Springer-Verlag. • Ratcliff, R & Rouder, J N (1998). Psychol. Sci.9: 347-56. • Roitman J D, & Shadlen M N (2002). J. Neurosci. 22: 9475-9489. • Siegmund, D (1985). Sequential Analysis. Springer. • Wald, A & Wolfowitz, J (1948). Ann. Math. Statisti. 19:326-39.