Download
1 / 1
10 likes | 164 Views
DTI Quality Control Assessment via Error Estimation From Monte Carlo Simulations. Examples of DWI artifacts. clustering of the excluded DWIs. Quality Control (QC) Processes. Pitfalls associated with the QC.

E N D
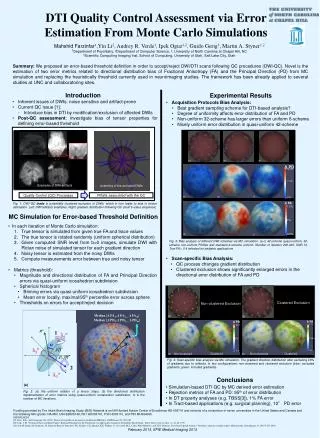
DTI Quality Control Assessment via Error Estimation From Monte Carlo Simulations Examples of DWI artifacts clustering of the excluded DWIs Quality Control (QC) Processes Pitfalls associated with the QC Mahshid Farzinfar1,Yin Li2, Audrey R. Verde1, Ipek Oguz1,2, Guido Gerig3, Martin A. Styner1,2 1Department of Psychiatry, 2Department of Computer Science, 2, University of North Carolina at Chapel Hill, NC 3Scientific Computing Imaging Inst, School of Computing, University of Utah, Salt Lake City, Utah Summary: We proposed an error-based threshold definition in order to accept/reject DWI/DTI scans following QC procedures (DWI-QC). Novel is the estimation of two error metrics related to directional distribution bias of Fractional Anisotropy (FA) and the Principal Direction (PD) from MC simulation and replacing the heuristically threshold currently used in neuroimaging studies. The framework has been already applied to several studies at UNC and collaboratoring sites. Introduction Experimental Results • Inherent issues of DWIs: noise sensitive and artifact-prone • Current QC issue [1]: • Introduce bias in DTI by modification/exclusion of affected DWIs • Post-QC assessment: investigate bias of tensor properties for defining error-based threshold • Acquisition Protocols Bias Analysis: • Best gradient sampling scheme for DTI-based analysis? • Degree of uniformity affects error distribution of FA and PD • Non-uniform 32-scheme has larger errors than uniform 6-scheme • Nicely uniform error distribution in quasi-uniform 42-scheme Fig. 1: DWI QC leads to potentially clustered exclusion of DWIs, which in turn leads to bias in tensor estimation. Left: DWI artifacts examples, Right: gradient distribution following QC (multi b-value sequence) MC Simulation for Error-based Threshold Definition • In each iteration of Monte Carlo simulation: • True tensor is simulated from given true FA and trace values • The true tensor is rotated randomly (uniform spherical distribution) • Given computed SNR level from b=0 images, simulate DWI with Rician noise of simulated tensor for each gradient direction • Noisy tensor is estimated from the noisy DWIs • Compute measurements error between true and noisy tensor • Metrics (threshold): • Magnitude and directional distribution of FA and Principal Direction errors via quasi-uniform icosahedron subdivision • Spherical histogram • Binning errors via quasi-uniform icosahedron subdivision • Mean error locally, maximal/95th percentile error across sphere • Thresholds on errors for accept/reject decision • Scan-specific Bias Analysis: • QC process changes gradient distribution • Clustered exclusion shows significantly enlarged errors in the directional error distribution of FA and PD Fig. 3: Bias analysis of different DWI schemes via MC simulation. (a-c) 42-scheme quasi-uniform, 32-scheme non-uniform Phillips and standard 6-scheme uniform. Number of iteration 200,000, SNR 10. True FA = 0.4 selected for pediatric applications Fig. 4: Scan-specific bias analysis via MC simulation. The gradient direction distribution after excluding 20% of gradients due to artifacts, in two configurations: non-clustered and clustered exclusion (blue: excluded gradients, green: included gradients). Conclusions • Simulation-based DTI QC by MC derived error estimation • Rejection metrics of FA and PD: 95thof error distribution • In DT property analyses (e.g. TBSS[3]), 1% FA error • In Tract-based applications (e.g. surgical planning), 10° PD error Fig. 2: (a) the uniform rotation of a tensor steps. (b) the directional distribution implementation of error metrics using quasi-uniform icosahedron subdivision, m is the number of MC iterations. Funding provided by The Infant Brain Imaging Study (IBIS) Network is an NIH-funded Autism Center of Excellence HD-055741 and consists of a consortium of seven universities in the United States and Canada and the following NIH grants: NA-MIC U54 EB005149, R01 HD055741, P30 HD03110, and P50 MH064065 REFERENCES [1] Jones, D.K., and Cercignani, M. (2010). Twenty-five pitfalls in the analysis of diffusion MRI data. NMR Biomed 23, 803-820. [2] Cook, J. M. "Technical Notes and Short Papers: Rational Formulae for the Production of a Spherically Symmetric Probability Distribution." Math. Tables Aids Comput. 11, 81-82, 1957. [3] [4] S.M. Smith, M. Jenkinson, H. Johansen-Berg, D. Rueckert, T.E. Nichols, C.E. Mackay, K.E. Watkins, O. Ciccarelli, M.Z. Cader, P.M. Matthews, and T.E.J. Behrens. Tract-based spatial statistics: Voxelwise analysis of multi-subject diffusion data. NeuroImage, 31:1487-1505, 2006. February 2013, SPIE Medical Imaging 2013