Download
1 / 18
180 likes | 399 Views
Quality Control and Error Assessment. Quality Control and Error Assessment. Map quality What is map accuracy? Positional accuracy Representational accuracy. Map quality. What can be called a map?

E N D
Quality Control and Error Assessment • Map quality • What is map accuracy? • Positional accuracy • Representational accuracy Quality Control and Error Assessment
Map quality • What can be called a map? • Graphical images which show, as far as possible within the limitations of scale and projection, the true absolute position. • Diagrams showing topological relationships, e.g. MTR maps. • Maps must show correct geometry, i.e. it should be possible to measure scaled distances and directions on the map. Quality Control and Error Assessment
A diagram of MTR routes A diagram shows topological relationships without correct geometry. Quality Control and Error Assessment
A map of MTR routes A map must show correct geometry so that one can measure the distance and direction on it. Quality Control and Error Assessment
Diagram or map? This map shows topological relationships with near correct geometry, but some elements are greatly exaggerated (e.g. roads and MTR stations). Note an indexing grid is shown with approximate distance measures. Quality Control and Error Assessment
Map quality • What makes a good map? • Correct geometric positions and relationships at the scale and map projection (accuracy) • Right representation of information for the purpose of the map (generalisation, simplification and exaggeration) • High cartographic presentations and correct use of symbolism (symbolisation) Quality Control and Error Assessment
What is map accuracy? • Map accuracy is a reflection of how closely the view portrayed by the map represents some particular view of the real world. • The actual production of maps requires a number of steps. Each step can introduce errors or inaccuracies, due to human factors, limitations of the equipment and required generalisation and limitations of the scale. Quality Control and Error Assessment
Components of map accuracy • How current are the data? • How complete are the data? • What level of generalisation of the real world has been placed on the map? • How ‘correctly’ have data been classified? • How far from its true location has an object been placed on the map? Quality Control and Error Assessment
Positional accuracy • All accuracy measures are relative. • The term ‘absolute accuracy’ is often used to identify how well the position matches certain predetermined map accuracy standards. • The standard deviation of the observations (or root mean standard error – RMS error) gives an indication of the spread of the observations. • Resolution - the minimum possible observable difference between adjacent measurements. Quality Control and Error Assessment
frequency r.m.s.e -2 -1 mean +1 +2 std RMS error Quality Control and Error Assessment
Error propagation • Consider: • Framework of a map from a control survey: R.M.S.E. = ±0.005 mm at map scale • Plotting of control (±0.10 mm) • Detail survey (±0.25 mm) • Compilation (±0.30 mm) • Human input in drawing (±0.20 mm) • Conventional reprographics techniques (±0.30 mm) • Digitisation/conversion (±0.20 mm) Quality Control and Error Assessment
Error propagation (Cont.) where i denotes individual step In this case: This would be equivalent to 11.54 m on the ground for data represented at 1:20,000 scale. This translates to a statement that 95% of the points in this data set would be positionally accurate to within approximately ±23 m (r.m.s.e. x 2) of their true location. Quality Control and Error Assessment
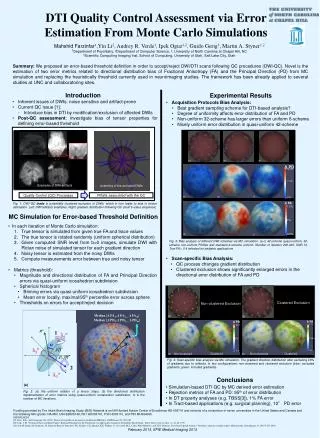
Representational accuracy • The representational accuracy involves the attribute accuracy. • Normally this involves the test of classification. • At nominal or ordinal levels the test is generally to justify either the classification is right or wrong. • Testing is conducted a posteriori using techniques such as confusion matrices (or confusion tables). Quality Control and Error Assessment
Confusion matrix Total accuracy = 733/889 = 82%; 68% (65/95) of pasture was correctly classified; 32% (34/107) of pasture was incorrectly classed as arable; while 24% (23/95) of pasture on the map was actually arable on the ground. For pasture, the commission error = 30/95 = 32%, the omission error = 42/107 = 39%. Quality Control and Error Assessment
Cohen’s kappa A measure considers significantly unequal sample sizes and likely probabilities of expected values for each class: where N = total number of samples;d = total number of cases in diagonal cells; Quality Control and Error Assessment
Kappa computation In our case: The optimal score is 1.0 (i.e. 100% correct). Quality Control and Error Assessment
Uncertainty • Fuzziness of data • Boundary fuzziness (where is the boundary of soil type A and B?) • Attribute fuzziness (is this building high?) • Proximity fuzziness (is this school close to the location A?) • Fuzzy logic: use of probability to deal with the fuzziness (e.g. There is an 87% probability that this school is close to point A.) Quality Control and Error Assessment