Download
1 / 10
100 likes | 181 Views
This study presents experimental evidence of magnetospheric generator regions observed by Cluster spacecraft. Conjunction geometry, Cluster and FAST data, and generator ingredients are analyzed. The findings point to concentrated energy flux mapping to the ionosphere, with correlations to auroral activity. The complex 3D structure of the plasma sheet boundary layer and its relation to Earthward flow regions are also explored.

E N D
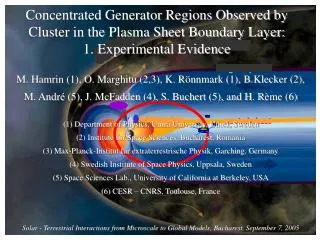
Concentrated Generator Regions Observed by Cluster in the Plasma Sheet Boundary Layer: 1. Experimental Evidence M. Hamrin (1), O. Marghitu (2,3), K. Rönnmark (1), B.Klecker (2), M. André (5), J. McFadden (4), S. Buchert (5), and H. Rème (6) (1) Department of Physics,Umeå University, Umeå, Sweden (2) Institute for Space Sciences, Bucharest, Romania (3) Max-Planck-Institut für extraterrestrische Physik, Garching, Germany (4) Swedish Institute of Space Physics, Uppsala, Sweden (5) Space Sciences Lab., University of California at Berkeley, USA (6) CESR – CNRS, Toulouse, France Solar - Terrestrial Interactions from Microscale to Global Models, Bucharest, September 7, 2005
Outline • Background • Conjunction geometry • Cluster data • FAST data • Conjunction timing • Generatoringredients
A magnetospheric generator (E·J<0) powers loads (E·J>0) in the auroral acceleration region and ionosphere. • The energy flux of a moderate aurora, ~10-2 W/m2, maps to ~10-5 W/m2 in the tail (mapping factor ~1000). If the generator region extends 107–108m (1.5–15RE) along the field line, the power density is ~10-13–10-12 W/m3. A Background A
A Background – Precautions... A • ... Choice of the reference system. • ... Derivation of the electric field by using EFW, CIS/CODIF and CIS/HIA data. • ... Evaluation of the current density from FGM data, via the Curlometer method.
B Conjunction GeometryB • Cluster 1 and FAST footprints (110km). • T96 model used for mapping. • Conjunctions at 22:23, 00:29, & 02:36 UT. • Rather low magnetospheric activity, Kp=1. • No optical data from ground/IMAGE/Polar.
FAST conjunctions CGR1 CGR2 CGR3 CGR4 CGR5 C Cluster Data Overview C • CODIF proton and FGM data, 19-20 Sep. 2005. • Energy spectrogram. (b) Density and temperature. • (c) Velocity (GSE). (d) Magnetic field (GSE).
CGR1 CGR2 CGR3 CGR4 CGR5 C Cluster Data Overview C • E·J <0 in the CGRs (d) which shows as sharp gradients in the cumulative sum (e). • E·J≈10-12 W/m3, consistent with the order of magnitude estimate. • During CGR1, 2, 4, and 5, Poynting flux (d) is directed to the Earth. • Most of E·J from the Y direction. • Quite good agreement between CIS and EFW.
Conjunction time Earthward energy flux 14 mW/m2 mapped to the ionosphere. D FAST Data for CGR1 D • The small scale structures in the inverted-V are comparable to the size of the CGRs mapped from Cluster to FAST. • The FAST electron energy flux is of the same order as the mapped Poynting flux.
Tail footprints of FAST at R=18 &20RE Cluster track XGSM≈19RE Conjunction CGR projection near Cluster E Conjunction Timing CGR5 E • CGR5 detected only on SC1 and 3 → CGR varies both in space and in time. • Estimated extension of CGR5 along the field line: ≤ a few 1000 km.
G Summary G • First in-situ experimental evidence for the crossing of generator regions! ☻ • The CGRs correlate with auroral precipitation observed by FAST. • CGRs observed close to the plasma sheet boundary (PSB). • CGRs when Jy>>0 and Ey<0. • Pkin0 near PSB => Jdiamag = BPkin/B2 JCurlometer • Complicated 3D structure of the PSB • Some CGRs partially colocated with Earthward Flow Regions => relation to BBFs?