Download

1 / 21
210 likes | 357 Views
Air Quality Modeling at Santiago, Chile: Impact of Transportation Sources. Héctor Jorquera Chemical and Bioprocess Engineering Catholic University of Chile jorquera@ing.puc.cl. Acknowledgements. Funding from National Commision for the Environment (CONAMA).

E N D
Air Quality Modeling at Santiago, Chile:Impact of Transportation Sources Héctor Jorquera Chemical and Bioprocess Engineering Catholic University of Chile jorquera@ing.puc.cl IUAPPA Sao Paulo
Acknowledgements • Funding from National Commision for the Environment (CONAMA). • CONAMA staff: M. Fernández, P. Oyola, J. García • PUC Staff and students: L. Cifuentes, J. Castro, R. Bown, J. Weissbluth, C. Gacitúa, A. Mitnik, and many others... • CENMA Staff: J.Escobar, A. Cabello • Swedish staff: L. Gidhagen, P. Ivarsson IUAPPA Sao Paulo
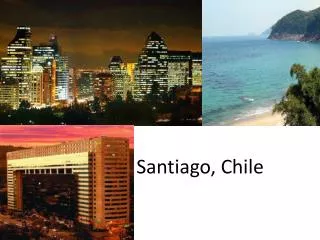
Santiago then… and in winter 1991 IUAPPA Sao Paulo
Modelling framework: CAMx(available at www.camx.com) • Simulate atmospheric processes: • wind advection • turbulent dispersion (mostly vertical) • chemical reactions (gas and PM phase) • PM generation and decay • deposition processes (dry and wet) • Dynamic emissions: • mobile sources • stationary sources • area sources This is the major source of uncertainty in the model output results! IUAPPA Sao Paulo
Emissions for Santiago (2000) IUAPPA Sao Paulo
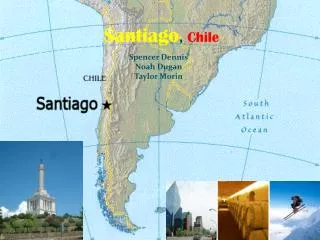
Modelling Domain Grid settings: 60 E-W, 40 N-S 2 x 2 km cells 8 vertical levels, up to 3 km a.g.l. Origin: 270 km (E), 6250 km (N) IUAPPA Sao Paulo
Complex Topography: IUAPPA Sao Paulo
Emissions at 8 am: CO IUAPPA Sao Paulo
Emissions at 8 am: NOx IUAPPA Sao Paulo
Model Evaluation: only within city boundaries... IUAPPA Sao Paulo
Case study: episode of May 1998 IUAPPA Sao Paulo
CO impacts, F, May 1998 IUAPPA Sao Paulo
CO impacts, M, May 1998 IUAPPA Sao Paulo
CO impacts, N, May 1998 IUAPPA Sao Paulo
NOx impacts, F, May 1998 IUAPPA Sao Paulo
NOx impacts, L, May 1998 IUAPPA Sao Paulo
NOx impacts, O, May 1998 IUAPPA Sao Paulo
O3 impacts, B, May 1998 IUAPPA Sao Paulo
O3 impacts, M, May 1998 IUAPPA Sao Paulo
Conclusions • A model for AQ impacts is operative for the greater Santiago metro area • Mobile source impacts properly simulated by the model (CO, NOx) • Features of the photochemistry are well described by the model simulations • Eastern side of Santiago is facing the highest photochemical impacts • EDB for mobile sources seems fine, but needs further refinements IUAPPA Sao Paulo
Future work • Include PM2.5 in CAMx simulations • Running another model with the same basic inputs (emissions+meteorology). • Improve the emission database with: • biogenic emissions • improved estimates of VOC emissions from stationary sources • better estimates of activity levels (time, space) for transportation sources • Produce a base case, ‘synthetic year’ IUAPPA Sao Paulo