Download

1 / 17
180 likes | 280 Views
Dive into the intriguing world of HI self-absorption in cosmic gas clouds and its correlation with molecular emissions. Discover the groundbreaking research and potential probes predating the Arecibo Telescope. Explore the mysteries of HI destruction and formation processes, along with the evolving states of atomic and molecular hydrogen in the Taurus region. Join the quest to understand the transition from atomic to molecular material and the birth of young stars.

E N D
HI Self - Absorption Peculiar Puzzle and Potential Probe Predating the Arecibo Telescope Paul F. Goldsmith
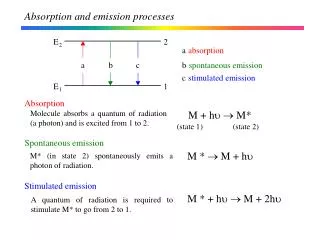
The 21-cm Line of Atomic Hydrogen • Discovered in 1951 by Ewen and Purcell (2002 Gordon Lecture at Arecibo) • Seen in EMISSION, which was not surprising since theories indicated that atomic gas in Milky Way would be warm (T ~ 100 K)
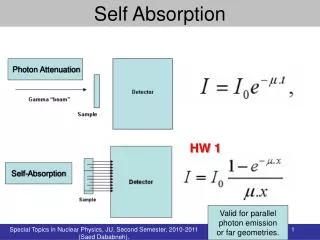
1960: “Self-Absorption” Terminology Appears for the First Time
Molecular Emission (OH) is Sometimes Associated With HI Self-Absorption Features
HINSA Spectra in Arecibo Survey of Taurus (Li & Goldsmith 2003) Width of the HINSA features is so narrow that they must come from COLD (< 20K) gas! Line minimum is so deep that in some cases the gas must again be below 20 K!
OH (shaded) 13CO(red) & C18O(green)Show General, But Not Perfect Agreement in L1544
Extremely Good Correlation of HI Narrow Self-Absorption and Molecular Emission Lines
Globule CB45 mapped in HI (not bounded) then 13CO (also not bounded) ………
Complete HI Self-Absorption Map Confirms Close Correlation with 13CO and C18O !
Significance of Atomic Hydrogen Within Well-Shielded Molecular Clouds • HI destroyedby conversion to H2 on grain surfaces • HI formed by cosmic ray destruction of H2 • STEADY-STATE ABUNDANCE of HI is ~ 1 cm-3 corresponding to 10-4 fractional abundance w.r.t. total proton density (due to preponderance of H2 )
HI Fractional Abundances are ~ 10 x Greater than Steady State Values
HI Fractional Abundance Measures TIME since start of Atomic to Molecular Conversion
How to Proceed From Here? • We have defined a large-scale survey of the Taurus region for HINSA to be carried out using ALFA – the L-band 7 element focal plane array • Map several hundred square degrees with good sensitivity • Compare with 12CO and 13CO maps from FCRAO (300 hours of telescope time already awarded) • ~ 100 hours of AO observing time required to get high sensitivity maps of COLD and WARM HI
The ALFA – TAUProject • When we compare the kinematics of cold and warm atomic gas -- are they the same? • What is the relationship of the atomic and the molecular gas? • What is the characteristic timescale for dark cloud cores as traced by residual HI? • Can we develop a scenario for the evolution from atomic to molecular material and then from molecular clouds to cores to young stars?