Download
1 / 19
190 likes | 381 Views
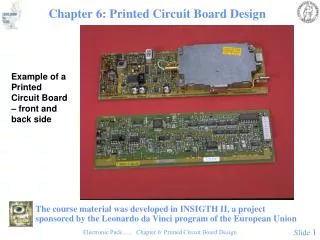
Printed Circuit Board Simulation: A Look at Next Generation Simulation Tools and Their Correlation to Laboratory Measurements. Shahana Aziz Northrop Grumman MAPLD September 8-10, 2004. Presentation Outline. Introduction – why is simulation important?

E N D
Printed Circuit Board Simulation:A Look at Next Generation Simulation Tools and Their Correlation to Laboratory Measurements Shahana Aziz Northrop Grumman MAPLD September 8-10, 2004
Presentation Outline • Introduction – why is simulation important? • Availability of advanced simulation tools • Simulation examples • Simulation accuracy: comparing simulations to lab measurements • Simulation on the James Webb Space Telescope Project • Conclusion 112/MAPLD2004
Introduction: Why Simulate? • Signal Integrity (SI) simulation is becoming more common with the availability of quality tools that fit seamlessly with the PWB layout flow. • SI simulation becomes more important with faster operational speeds and higher density requirements. • As device edge rates get faster it is becoming imperative to consider transmission line effects and possible signal integrity problems in the PWB design. Simulation makes it possible to do this during the layout phase without costly re-spins and difficult lab work-arounds. • SI issues such as undershoot, overshoot, ringing, crosstalk, as well as power and ground integrity can be modeled and PWBs can be fabricated assuring electrical performance, which saves both cost and schedule and improves reliability and quality. 112/MAPLD2004
Advanced Simulation Tools • In the CAD design flow, SI simulation fits into the board layout phase • Both pre and post route simulation can be performed • Single PCB or Multi PCB system level simulation possible • The tools that are available today are both fast and accurate • Pre-route simulation is used to determine the placement of critical components, the effectiveness of the PCB stack-up structure, routing requirements for critical signal paths etc • Post route simulation can be used to mitigate any potential SI or timing issues and find the solution to problems in the form of routing changes, termination schemes, optimized termination values, IO buffer selection, decoupling capacitor selection etc – all before hardware is fabricated • All the results in this paper were obtained using Mentor Graphics’ Interconnectix Synthesis (IS) and Sigrity’s Speed2000 simulation tools. 112/MAPLD2004
Simulation Examples Example 1: Selecting Termination and Determining Skew • Simulation used to select termination value and topology • Simulation also used to determine skew between different destinations • No termination reveals overshoot and undershoot outside of device electrical specifications • 33 Ohm Series termination gets rid of overshoot and undershoot • RC termination slows down the edge too much for the operating frequency, so signal does not reach 0 Volts completely • Use simulation to measure skew between various destinations to determine optimum routing, delay budget 112/MAPLD2004
Simulation Examples Example 2: What-if Exploration • Simulation used to test different device IO buffers (AX/SX, high/slow slew) • Choose optimum IO type that meets both timing and SI requirements • AX slow slew driver cannot meet output timing • AX high slew driver violates device abs max specs SI and Timing Solution: • 45 Ohm Termination at source • Cleans Signal, meets timing • SX simulation shows high and slow slew have same rising edge • Slow slew only effects falling edge • SI still a problem with SX 112/MAPLD2004
Simulation Examples Example 3: Decoupling Capacitor Effectiveness and Low Impedance Power Delivery • Simulation used to determine the impedance of FPGA core voltagedelivery path over a range of frequencies • Simulation helps find optimum bypass capacitor placement and values • Supply regulator located at U27 • Impedance simulated at supply input of U31 112/MAPLD2004
Simulation Examples Example 3 Continued • Zin simulated in 3 cases: • Case 1 (red): With no on board decoupling capacitors, low frequency resonance seen • Case 2 (purple): With decoupling capacitors, low frequency resonance much reduced, 1st impedance spike seen at 800 MHz • Case 3 (blue): By adding 8 capacitors with low ESR at 800 MHz, impedance at that frequency further reduced 112/MAPLD2004
Simulation Examples Example 4: Effect of Simultaneous Switching Outputs (SSO) • Simulation used to determine effect of a bi-directional data bus with 32 simultaneously switching outputs • SSO effect observed on data bit and power supply • Simulation Case 1 (blue): U31 (Xilinx driver) • Simulation Case 2 (red): U30 (Actel driver) U31 U30 112/MAPLD2004
Simulation Examples Example 5: Running Batch Simulations • Simulation can be used to generate summary and detailed reports of SI issues • Crosstalk violation report • Victim and aggressor net details • Board timing report 112/MAPLD2004
How Accurate are the Simulations? • Simulation useful only if correlation exists to real world • Lab measurements taken on built hardware • Different device drivers compared using lab measurements • To date, measurements taken on Actel, Xilinx, LVDS driver devices • Four examples presented, more measurements on-going • Simulations found to have good correlation to actual signal 112/MAPLD2004
Comparison Examples Example 1: Xilinx Output Characteristics • Signal measured at receiver • Simulation at the same point • Rise/fall time, high/low voltage and wave shape agree closely in both simulation and lab measured results Actual Waveform Simulated Waveform 112/MAPLD2004
Comparison Examples Example 2: Waveform Comparison at Three Nodes Along the Trace • Signal measured at receiver, driver output and termination resistor pad • The actual and simulated waveform at all 3 points agree closely • Delay between driver output and destination input agrees • Wave shape, voltage values agree • Rise time at destination agree Actual Waveform The 3 waveforms show signal measured at: • Driver output pin (pad 1 of termination resistor) • Pad 2 of termination resistor • Input at destination device pin Simulated Waveform 112/MAPLD2004
Comparison Examples Example 3: Actel Output Characteristics • Voltage high/low value agree fairly closely • Simulation shows more ringing then actual • Rise time in lab 2.07 ns while in simulation .9 ns • Fall time in lab 1.485 ns while in simulation .7 ns 112/MAPLD2004
Comparison Examples Example 3 Continued: Possible reasons for mismatch • Simulation assumed part directly on the board, in reality socket is installed. The socket parasitics may cause some of the variation • Using the min current IBIS curve, it is possible to achieve a slower rise and fall time in simulation, which is closer to the actual • Actel AX parts are a new device family, so the IBIS models currently available may not be representative of a typical part Future Plans to compare Actel models: • Plan to re-simulate if newer AX IBIS model becomes available. • Plan to re-take lab measurement on hardware where socket is not installed • Plan to do comparison measurements on hardware which has SX parts and see if similar discrepancy exists with the SX family models 112/MAPLD2004
Comparison Examples Example 4: Looking at Actel Drivers again • Simulate 3 termination cases: 0Ohm, 45 Ohm, 56Ohm • Simulation shows: • ~.9V undershoot with 0 Ohm • ~.58V undershoot with 45 Ohm • ~.38V undershoot with 56 Ohms • Measurement shows: • ~1.1V undershoot with 0 Ohm • ~.48V undershoot with 45 Ohm • ~.260 undershoot with 56 Ohm Even though some mismatch exists with Actel model, simulation provides valuable information leading to proper termination selection and avoiding electrical overstress (EOS) hardware environment 112/MAPLD2004
Future of SI Simulation • Currently the NASA Goddard Space Flight Center is incorporating the use of simulation based SI analysis into the module design flow on the James Webb Space Telescope project. • The Integrated Science Instrument Module Command and Data Handling hardware design team is using simulation tools to guarantee board performance before building hardware and will continue this methodology into the flight board designs. • Currently the development units are being delivered and comparison measurements are being made in the lab with each hardware module that becomes available. 112/MAPLD2004
Conclusion • Simply relying on traditional laboratory based SI analysis for module designs is no longer feasible due to the complexity of the circuit board designs and the changing device technologies. • As designs get more complex and device families get faster, simulation tools will give design engineers an extra level of confidence in the hardware that they build and deliver. 112/MAPLD2004
References • http://www.eigroup.org/ibis/ • http:// www.mentor.com/icx • http:// www.sigrity.com • http://www.actel.com • http:// www.xilinx.com 112/MAPLD2004