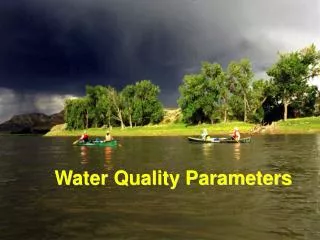
Water Quality Parameters
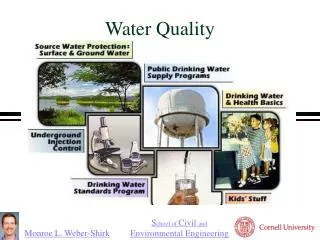
Water Quality Parameters. Parameters Included. Visual Assessment Temperature pH Dissolved Oxygen (DO) Biochemical Oxygen Demand (BOD) Conductivity / Total Dissolved Solids (TDS) Turbidity / Total Suspended Solids (TSS). Visual Assessment. What is a Visual Assessment?.

Water Quality Parameters
E N D
Presentation Transcript
Parameters Included • Visual Assessment • Temperature • pH • Dissolved Oxygen (DO) • Biochemical Oxygen Demand (BOD) • Conductivity / Total Dissolved Solids (TDS) • Turbidity / Total Suspended Solids (TSS)
What is a Visual Assessment? • In addition to making quantitative measurements, it is often important to make a visual assessment of a river or lake. • The assessment may help explain the quantitative data. • Codes are used to help the observer make accurate assessments. • Several parameters are assessed.
Weather Odor Algae Foam Turbidity Flow Oil Litter Color Land Uses What is a Visual Assessment?
Odor 0. None 1. Feces 2. Fishy 3. Musty 4. Decay 5. Ammonia 6. Petroleum 7. Sulfide 8.Chlorine 9. Other Algae 0. None 1. Light (<5%) 2. Moderate (5-25%) 3. High (26-50%) 4. Dense (>50%) A complete visual assessment data chart (Excel format) is available at the website below. Sample Observation Codes State Water Resources Control Board-Citizen Monitoring http://www.swrcb.ca.gov/nps/docs/stream_shorewalk_sopdata.xls
Why is Visual Assessment Important? • Each characteristic could have a number of explanations. For example the presence of foam might indicate one of the following. • Detergents • Excessive nutrients • Natural protein source • Additional information is available at the website below. http://www.swrcb.ca.gov/nps/docs/protocols_visual_assess_factsheet.doc
Why is Visual Assessment Important? • The bottom line is that visual parameters help to support and explain the quantitative data that is collected.
What is Temperature? • The answer to this question seems obvious. • Temperature is the measure of the average kinetic energy in a system. • Scientists measure temperature in degrees Celsius (°C). • The nonscientific community uses the Fahrenheit scale (°F). • Both scales are arbitrary.
How is Temperature Measured? • Traditional thermometers work very well. • A thermometer is fragile and can be easily broken in the field. • Good thermometers have adequate reproducibility.
Why is Temperature Important? Temperature influences many things. -Dissolved oxygen -Rate of photosynthesis -Metabolic rate -Sensitivity of organisms to environmental factors -Biological clocks
Why is Temperature Important? Natural factors influence temperature. -Sunlight -Flow -Depth of water - Color and Turbidity -Inflow of surface water -Inflow of groundwater
Why is Temperature Important? Human factors affect temperature. -Removal of vegetation -Soil erosion -Storm water runoff -Changes in the stream morphology -Cooling water discharges
How does temperature affect fish? State Water Resources Control Board-Citizen Monitoring http://www.swrcb.ca.gov/nps/docs/Temp.doc
What is pH? • pH is a measure of the acidity, [H+], or basicity (alkalinity), [OH-], of a solution. • The scale is typically measured from 0 to 14. • A pH value of 7 is considered to be neutral, neither acid nor base. • The following is graphical representation.
Neutral [H+]=[OH-] pH 0 7 14 Basic [OH-]>[H+] Acidic [H+]>[OH-]
[H+]>[OH-] [OH-]>[H+] [H+]=[OH-] 0 7 14 What is pH? pH is a logarithmic function. That is, pH = -log10 [H+]. This simply means that a change of one pH unit represents a 10 fold change in the acidity, e.g. pH 5 is ten times more acidic than pH 6.
For the More Advanced Students pH = -log10 [H+] So if: pH = 5 Then 5 = -log10 [H+] -5 = log10 [H+] 10-5 = [H+] or [H+] = 10-5 M
pH levels in our lives Water on the Web http://wow.nrri.umn.edu/wow/
Measuring pH • The most convenient way to measure pH is to use pH paper. • The paper pictured is impregnated with four acid/base indicators. • It is a simple matter to wet the paper and compare the colors.
Measuring pH • pH can also be measured using a variety of digital meters. • Digital meters can be very reasonable or very expensive depending upon your needs.
Why is pH important? • Ideally, the pH range for fresh water is between 6.5 and 8.5 (for sea water the range is 7.5 to 8.4). • To differing extents fish species suffer outside of this range. • The following chart will give some indication specific pH requirements for certain organisms.
Why is pH important? Some organisms can tolerate a wider pH range. State Water Resources Control Board-Citizen Monitoring http://www.swrcb.ca.gov/nps/docs/Ph.doc
Why is pH important? • pH can affect and be affected by atmospheric chemistry. • Dissolved CO2 – more CO2 more acidic • Other nonmetallic oxides • pH can affect and be affected by geological chemistry. • Dissolved minerals – more metalic oxides the acidic • Other sources of minerals • Buffering capacity – soils with calcium can buffer acid conditions
A useful pH grading system A—7.0-8.0 B—6.5-6.9 or 8.1-8. C—6.0-6.4 or 8.6-9.0 D—5.5-5.9 or 9.1-9.5 F—<5.5 or >9.5 City of Lodi—Storm Drain Detectives http://www.lodi.gov/Storm%20Drain%20Detectives/index.htm
What is Dissolved Oxygen? • Dissolved oxygen, O2, is a required biological respiration in the aquatic community. • It is commonly measured in mg/L (ppm). • The amount of dissolved oxygen is dependent upon a number of physical and biological factors.
Physical factors Increased water temperature decreases DO. Turbulence increases DO. Increases in salinity decrease DO. Oxidizing chemicals decrease DO Altitude decreases DO Biological factors Increased photosynthesis increases DO. Decomposition of organic matter increases respiration and decreases DO. What Affects Dissolved Oxygen?
How is DO measured? • Colorimetric methods • Chemet system based on the oxidation of Indigo Carmine. • Rhodazine D • Titration • Winkler method • An iodometric method more precise than colorimetric
How is DO measured? • Digital meters use a membrane system that gives more precise values than colorimetric. • Based on the rate of diffusion of O2
What is Oxygen Saturation? • Dissolved oxygen can also be expressed in % saturation. • This is a measure of how much oxygen the water should be able to hold. • Saturation is temperature dependent. • A nomograph shows the relationship.
How Do Dissolved O2 and Temperature relate? Values are for fresh water at sea level. Derived from: Standard Methods for the Examination of Water and Wastewater.
Using a nomograph or ppm http://www.phschool.com/science/biology_place/labbench/lab12/design.html
A useful DO grading scale A—85% Saturation B—75-84% C—65-74% D—55-64% F--<55%, <5.0mg/L City of Lodi—Storm Drain Detectives http://www.lodi.gov/Storm%20Drain%20Detectives/index.htm
What is Turbidity? • A measure of water clarity • The murkier the water, the higher the turbidity. • Turbidity reduces the transmission of light into water. • Turbidity increases as a result of suspended solids in the water.
Sources of Turbidity • Phytoplankton blooms • Soil erosion • Waste discharge • Urban runoff • Abundant bottom feeders
Why is Turbidity Important? • Suspended particles diffuse sunlight and absorb heat. • As temperature increases, DO decreases. • Suspended solids can clog fish gills • Less light is available for photosynthesis. • As sediment settles gravel beds become fouled.
How is Turbidity Measured? • Secchi disk • Measures depth at which disk is no longer visable • Measures water transparency • Useful for deep water
Turbidimeter optical device that measures scattering of light (most accurate) Measure in NTU or JTU Turbidity in the lab and field
What is the Concern? • Increase in turbidity in reservoirs in southwestern U.S. • Increase in turbidity in Delta waters during dry years • Degrades drinking water quality. Water treatment costs increase. • Increase of calcium build up on pipes
Some Turbidity Data Water Quality Testing and Monitoring Program for Middle Schools and High Schools. San Diego County Water Authority.
Nitrates • Nitrate NO3- , a form of nitrogen acts as nutrient in streams and rivers. • Nitrogen is a major component of proteins in all living things.
Sources of Nitrates • Nitrogen can enter waterways as runoff from animal wastes, storage areas, fertilized lawns, fields and yards, and agricultural croplands or as discharge from car exhausts.
What are the concerns? • Excess nitrogen in waterways can cause algae bloom – rapid growth of algae. When algae die, decomposers breakdown the algae and use up all the oxygen. This causes odors and toxins and a depletion of oxygen for the fish and plant life.
Nitrogen tests • We will be use the snap test for nitrogen • Colorimetric methods • Snap tests .
Nitrate Test Results • 0.0 to 0.08 ppm - Natural levels. Safe for drinking water • Any reading higher – Danger level- algae growth accelerates
Phosphates • Essential for plant growth and animal metabolism. Found in DNA, ATP, lipids. • Phosphate is a limiting factor for most plants because it is found in small quantities in the soil.