Download
1 / 49
490 likes | 632 Views
Spatial Analysis of Erosion over Five Decades near Barrow, Alaska. William F. Manley INSTAAR, University of Colorado. Acknowledgements:. Leanne Lestak & Jim Maslanik NSF OPP HARC & ARSLP. Background: radar imagery over digitial elevation model. Arctic Workshop 2004. Goals.

E N D
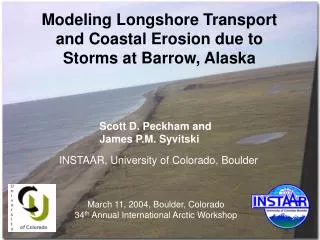
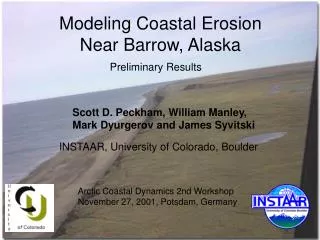
Spatial Analysis of Erosion over Five Decadesnear Barrow, Alaska William F. Manley INSTAAR, University of Colorado Acknowledgements: Leanne Lestak & Jim Maslanik NSF OPP HARC & ARSLP Background: radar imagery over digitial elevation model Arctic Workshop 2004
Goals • Utilize high-resolution imagery and GIS layers • Measure and understand spatial variability of erosion • Address concerns related to: • controls on erosional processes • sediment flux to the nearshore environment • coastal hazards at Barrow • erosion within context of accelerated change
Georectification of 1955 photos • 20 frames • 2nd order polynomial image-to-image • average of 23 control points per photo • average of 9 check points per photo • resolution of 1.4 m, RMS error of 2.6 m
Digitize 1955 shoreline • points spaced every 20 m • 250 km of shoreline
Measure offset • NEAR command
Calculate rate • time-averaged rates • - for erosion • + for accretion
Barrier Islands and Spits • 1955 shoreline from DRG’s
Barrier Islands and Spits • 2002 shoreline from ORRI
Barrier Islands and Spits • horizontal displacement per year
Errors Considering: • georectification • digitizing • transient waterline shifts Mainland coast: Barrier features: • 3.1 m • 0.07 m/yr • 94% of observations exceed error • 26 m • 0.6 m/yr • 86% of observations exceed error
Mainland Erosion • 91% of coast has experienced erosion • average rate of -0.91 m/yr • average displacement of -42.5 m
Barrier Erosion • average rate of 3.7 m/yr • average displacement of 173 m
Patterns LOW sand & gravel beaches backed by bluffs HIGH low coastal plain with ice-rich peaty soils
Patterns short segments of beach progradation migration of barrier islands LOW sand & gravel beaches backed by bluffs HIGH low coastal plain with ice-rich peaty soils LOW within sheltered bays & inlets
Erosion near Barrow -0.2 to -0.8 m/yr
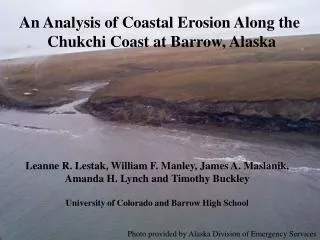
Conclusions • High bluffs & coarse beach sediment protect the Chukchi shoreline • Low bluffs with ice-rich, peaty soils are susceptible along the Beaufort coast • Fetch plays an important role, with bays and inlets protected at a variety of scales • Erosion appears more pronounced where ice-wedge polygons are strongly developed • Near Barrow, human activities may have played a role, and erosion is a concern
Future Directions • Quantitative analysis of erosion as a function of bluff height, fetch, coastal orientation, landscape classification, sea-ice concentration, etc. • Increased temporal resolution to identify importance of extreme events & possible acceleration of erosion