Download
1 / 41
410 likes | 549 Views
Development and Evaluation of a High Resolution Oceanic General Circulation Model (OGCM). Yongqiang YU, Hailong Liu, Pengfei Lin, Xuehong Zhang, Huier Mo LASG/IAP/CAS Guilin, China, October 28 th -31 st , 2013. Outline. Introduction Model Description

E N D
Development and Evaluation of a High Resolution Oceanic General Circulation Model (OGCM) Yongqiang YU, Hailong Liu, Pengfei Lin, Xuehong Zhang, Huier Mo LASG/IAP/CAS Guilin, China, October 28th-31st , 2013
Outline • Introduction • Model Description • Numerical and Parallel Computing Schemes • Large-scale Circulation • Marginal Sea Circulation near China • Summary
How to reduce the Model Uncertainties • Increase spatial resolution of climate system models • Improve Numerical Methods • Improve the subgrid physical parameterization schemes • Introduce new component models
Outline • Introduction • Model Description • Numerical and Parallel Computing Schemes • Large-scale Circulation • Marginal Sea Circulation near China • Summary
Ocean Model Development History at LASG/IAP • 4-Level (4X5) OGCM by Zhang et al. (1989) Convex-C120 • 20-Level (4X5) OGCM by Chen et al. (1997) Convex-C3210 • 30-Level (2X2) GCM by Jin et al. (1999) SGI workstation • LICOM1.0 (0.5X0.5) by Liu et al. (2003) SGI and IBM • LICOM2.0 (0.1X0.1) by Liu et al. (2012) and Yu et al. (2012) • (TH-1A)
Sub-Grid Physical Parameterizations • Turbulent Mixing schemes (Canuto, 2003,2007) • Solar radiation penetration scheme • Bottom drag scheme • Bi-Harmonic diffusion/viscosity
Outline • Introduction • Model Description • Numerical and Parallel Computing Schemes • Large-scale Circulation • Marginal Sea Circulation near China • Summary
Z-Coordinate and Latitude-Longitude grid • Leap-frog time integration • Barotropic and Baroclinic Split Technology • 2-order central difference for momentum advection • Two-step shape-preserving scheme for temperature and salinity advection • Implicit scheme for vertical diffusion/viscosity • 2-D MPI Parallel Computing
Speed-up in TianHe-1A • Zonal filter in high latitudes lead to imbalance • Serial IO becomes key bottleneck
Experiment Design of LICOM2.0 • 12-year spin-up forced NCEP climatological flux • 2000-2007 simulation by daily forcing form NCEP Heat Flux and QuickSCAT wind stress • A 60-year integration with NCEP reanalysis. • 1 model year/ 2 days
Outline • Introduction • Model Description • Numerical and Parallel Computing Schemes • Large-scale Circulation • Marginal Sea Circulation near China • Summary
5-daily mean integrated transports MOC=FC+EK+MO FC:Florida Current transport ,r=0.43 RAPID (dash line) model (solid line) MOC, r=0.62 EK:Ekman transport r=0.96 MO:upper mid-ocean transport , r=0.3
Power Spectrum of 5-daily mean transports CMIP3models (from Sarojini et al. 2011) the black line is OBS hardly reproduce the 30 to 40 days period LICOM successfully represent this feature LICOM
Velocity profile of ITF (m/s) . Lombok Makassar Ombai Lifatomola Timor
Outline • Introduction • Model Description • Numerical and Parallel Computing Schemes • Large-scale Circulation • Marginal Sea Circulation near China • Summary
Depth-Longitude section of observed and simulated temperature along 35N
Jan Apr Jul Oct
Luzon transport in upper(0-500), middle (500-1500) and deep layers (<1500).
Summary • Compared with coarse resolution of the ocean model LICOM, the eddy-resolving version well reproduces the meso-scale eddies as observed. • The model doesn’t only reproduce equatorial current system such as EUC, ETC etc, but also oceanic circulation in the North Pacific. • The model can simulate the large meander of Kuroshio, as well as its interannaul variability. • The marginal sea circulation near China are also reproduced by the eddy-resolving model. • The mass transport along 26.5N and Indonesian straits are well reproduced.
Ongoing Work • Sub-grid Parameterizations: Tidal mixing, wave mixing, internal wave mixing etc. • Dynamical Core: Time integration scheme • Tripole Coordinate: reduce load imbalance • Parallel Optimization : MPI + Open MP • High resolution coupled Ocean-Atmosphere Model
Next Step • 在LICOM模式中引进三极坐标 • 改进湍流混合方案 • 引进潮汐混合、波浪混合、底边界层混合方案等 • 进行高分辨率耦合试验.
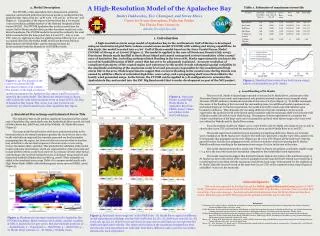
Time mean temperature transects at 26.5ºN LICOM can reproduce the observational temperature structure WOA09 LICOM LICOM-WOA09 LICOM can’t resolve the Bahamas at the western boundary, and the depth of Florida Straits is too shallow compared to the real topography.
Schematic of MOC monitoring array at 26ºN from Rayner et al.,2011 QuickScat
meridional heat transport R=0.68 Underestimated by 0.2PW
Mass and Heat Transport along 26.5N in North Atlantic Purpose: evaluate the ability of the eddy-resolving ocean circulation model LICOM to reproduce the variabilities of AMOC on the time mean scale and the time scales less than one year against the high frequency observational data (RAPID data) along 26.5 ºN in Atlantic.
OBS (2007) OBS (2005) Model (2007) Model (2005) Observed and Simulated SSH Anomaly in 2005 and 2007
Zonal Current along 160E Mar Dec Jun Sep
LICOM SODA Deep layer transport across Luzon strait