Download
1 / 38
380 likes | 597 Views
International Balance Sheets, Global Imbalances and Governance. The External Wealth of Malaysia. Andrew Sheng. Preliminary analysis. Contents. Introduction. Global Overview. Brief overview of the current trends in global external position.

E N D
International Balance Sheets, Global Imbalances and Governance The External Wealth of Malaysia Andrew Sheng Preliminary analysis
Contents Introduction Global Overview Brief overview of the current trends in global external position Comparative perspective of regional countries through the crisis and after Regional Perspective Malaysian Scenario A closer look into Malaysia’s external position Conclusions Implications for policy imperatives and future directions for research and surveillance
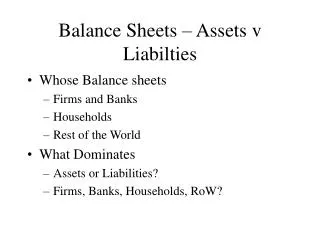
Introduction Financial crises, growing external imbalances and financial globalisation have resulted in increasing interest in looking at economies from a balance sheet perspective. The balance sheet approach focuses on net assets and liabilities (stock) rather than the IMF practice of looking at flow variables. Recently, IMF’s Lane and Milesi-Ferritti* introduced estimation of external positions for 140 countries from 1970-2004, presenting a valuable set of data previously not consistently available for scrutiny. This is a rich data-set. * Lane, Philip R., and Gian Maria Milesi-Ferretti2006, "The External Wealth of Nations Mark II: Revised and Extended Estimates of Foreign Assets and Liabilities, 1970-2004" IMF Working Paperno 06/69, IMF
Exciting New Data Source The balance sheet data, which are derived from flow data and partially stock data, give us an unprecedented total picture of inter-connectivity of stock and flow relationships between trading partners. In the past, IMF surveillance focused on countries, not on the linkages and transmission mechanisms of trade and capital flow shocks. The Lane and Milesi-Ferritti* estimates allow a rich analysis of where shocks emanate and how they flow through balance sheets, creating vulnerabilities that authorities were not able to detect before such data. * Lane, Philip R., and Gian Maria Milesi-Ferretti2006, "The External Wealth of Nations Mark II: Revised and Extended Estimates of Foreign Assets and Liabilities, 1970-2004" IMF Working Paperno 06/69, IMF
Major trends in global external positions Three trends are particularly notable: • International financial integration has increased significantly • Global imbalances have widened sharply • Differences in rates of return between external assets and liabilities lead to significant shifts in international resources * The analyses presented here are mainly drawn from the Lane and Milesi-Ferretti (2006) dataset.
Financial Globalisation Rising International asset trade increased markedly, especially since mid-1990s. Total foreign assets and liabilities in most countries are much higher than the level of GDP Source: Lane and Milesi-Ferretti (2006)
Financial Globalisation in Equity instruments This heightened financial integration is true for both developed and developing countries, especially in cross-border equity holdings Source: Lane and Milesi-Ferretti (2006)
Global Imbalances Widening for US & EU Recent years saw sharp widening of global imbalances Source: Lane and Milesi-Ferretti (2006)
Asia and OPEC are now net creditors Japan, emerging Asia and oil producing countries are clear creditors, while the United States saw sharp deterioration in net external position. The rest of the world are essentially net debtors. Source: Lane and Milesi-Ferretti (2006)
Rate of Return Differentials Matter Differences in rates of return on assets and liabilities significantly affect net external positions of countries and lead to shifts in resources across borders US ‘superior’ return differential explains its relatively stable net external position despite massive net external borrowings in recent years Notes: 1. Figures are in real domestic-currency terms 2. Malaysia figures are returns on direct investment only for 2000-2004, due to the lack of publicly available financial account flow data. Sources: Lane, Philip R., and Gian Maria Milesi-Ferretti, 2005, “A Global Perspective on External Positions" IMF Working Paper no 05/161, IMF; Author’s Estimates
Onset of the Asian Crisis Except for Korea, countries affected by the crisis saw significant worsening of net foreign positions prior to the crisis, breaching negative 60% of respective GDPs. Source: Lane and Milesi-Ferretti (2006)
After the Asian Crisis After 1998, net foreign positions improved in all crisis countries, but Malaysia made the most progress, putting the country’s external balance sheet virtually at balance. Source: Lane and Milesi-Ferretti (2006)
A Wider Comparison Except Korea, the crisis countries clearly have very different net external positions compared to the ‘Asian tigers’ China was relatively unaffected by the crisis, and enjoyed improving net external position due to peg to dollar Source: Lane and Milesi-Ferretti (2006)
China: Currency Peg forced Structural Adjustment China’s GDP powered ahead during and after crisis, while others only recovered to pre-crisis level in the past two years Source: Lane and Milesi-Ferretti (2006)
China: FDI driver of growth & competitiveness Stock of FDI liabilities relative to GDP have declined for crisis economies since 1998, while FDI to China kept on expanding… Source: Lane and Milesi-Ferretti (2006)
Net External Position: Composition The profile of foreign asset for Malaysia evolved considerably from 1970 to 2004. The 1980s witnessed large buildup of debt liabilities. Source: Lane and Milesi-Ferretti (2006)
Net External Position: Composition The 1990s saw an increase in net portfolio equity liabilities Source: Lane and Milesi-Ferretti (2006)
Net External Position: Composition After the crisis, Malaysia saw buildup in foreign reserves and overall improvement of net external position Source: Lane and Milesi-Ferretti (2006)
Net External Position: Composition Source: Lane and Milesi-Ferretti (2006)
External Wealth and the Economy: Some Observations Income Total foreign assets and liabilities (% of GDP), especially the former, have grown in line with income. This suggests a positive relationship between level of income and the holding of foreign assets Sources: Lane and Milesi-Ferretti (2006); Department of Statistics, Malaysia
If NEP worsens to -50% of GDP, crisis looms Vulnerabilities Both cases of crises (1985, 1997) were preceded by bouts of worsening net external position, both breaching negative 50% of GDP Sources: Lane and Milesi-Ferretti (2006); Department of Statistics, Malaysia
Real Effective Exchange Rate & NEP Net external position shows a negative correlation with REER, pointing to a probable link between exchange rate policy and the improvement in external position after the crisis Sources: Lane and Milesi-Ferretti (2006); Bank for International Settlement; Author’s estimates
Public Investment associated with Debt + FDI growth Investment Capital formation, particularly public investment, showed very significant positive relationship with foreign debt and FDI liabilities The relationship was clearest in late 1980s up to 1998, in which up to 90% of variations in investment can be explained by changes in foreign debt liabilities Note: Calculated as correlation between rate of change of respective nominal variables, investment variables lagged 2 years. Sources: Lane and Milesi-Ferretti (2006); DOSM; Author’s estimates
Foreign Portfolio Flows drive Equity Market Share Market Foreign portfolio equity liabilities are very significantly correlated to share market movements The high level of share market activities for the period 1992 to 1998 was clearly related to the steep inflow in portfolio equities Sources: Lane and Milesi-Ferretti (2006); KLSE; Author’s estimates
Further Analysis: Valuation Effect The difference between net external position and cumulated current account provides an estimate of the valuation component* of net external assets, which represents: • cumulated value of net capital gains; and • exchange rate adjustments Sources: Lane and Milesi-Ferretti (2006); DOSM; Author’s estimates * Estimate using methodology presented in Gourinchas, Pierre-Olivier, and Helene Rey, 2005, “From World Banker to World Venture Capitalist: US External Adjustment and the Exorbitant Privilege,” NBER Working Papers 11563, National Bureau of Economic Research
Persistent Negative Valuation Effect Two clear stylised patterns are notable: • Valuation effect has been persistently negative suggesting large net capital losses, especially during period when foreign liabilities was large* • Depreciation of ringgit corresponded to worsening valuation effect, as shown in the shaded areas Sources: Lane and Milesi-Ferretti (2006); BNM; Author’s estimates * Given the conceptual relationship, this can potentially explain the large return differential between foreign assets and liabilities
Implications of Analysis Malaysia clearly in much better shape and less vulnerable to external flow shocks - fiscal retrenchment has worked Malaysia is not short of savings and therefore improvement of domestic financial intermediation would cushion Malaysia against external shocks Letting excessive savings flow out, while deepening domestic intermediation clearly reduces overall risks (equity return swap). We need NATIONAL RISK MANAGEMENT strategy and policy. The way we finance development and growth exposes us to different risks. When we are net debtor (negative NEP), we are exposed to shocks on our debt. When we are net creditors, we must learn how to manage our return on assets.
Implications on Policy Policy Management for rich country (net creditor) very different from poor country (net borrower). Example: If net assets are held in USD and liabilities are in Yen, then Malaysia would be in double squeeze, a declining asset and appreciating liability. This is true not only of Public Sector Risk Management, but also for Private Sector. This makes the case for faster development of Asian financial markets, so that we can invest in countries and currencies that appreciate together relative to USD/Euro, rather than being depreciated on our asset holdings.
Direction of Research Increase in international financial integration increases exposure to external financial shocks, meaning that balance sheet vulnerabilities will need to be closely monitored. Thus, research initiatives should be directed to improve the understanding of the economy through the balance sheet perspective. The devil is in the details. We need to study more carefully not just the components of our balance sheet and flows, but also the inter-relationship with other economies.
A Macro-Micro Prudential Framework Surveillance should be reemphasised to include the balance sheet approach to complement the existing surveillance effort. Macro-behaviour have micro-origins, and micro-behaviour have macro-implications Comprehensive surveillance would require detailed understanding of balance sheet conditions of all the different sectors of the economy, from the financial sector to the public sector and so on. This means that different departments within the central bank [and with other regulators] need to have greater co-operation and information sharing in order to have a holistic view of potential shocks to the financial system. * Mathisen, J. and Anthony Pellechio, 2006, “Using the Balance Sheet Approach in Surveillance: Framework, Data Sources, and Data Availability" IMF Working Paper no 06/100, IMF, provides an excellent starting point for the understanding of the balance sheet surveillance approach.
Growth, Stability and Governance Economic Growth can only occur in environment of political and financial stability. Central Bank is in charge of monetary stability and systemic financial stability. Central Bank challenges are very different from emerging market to middle income market to developed economy. As markets get more sophisticated, regulation and oversight of systemic stability becomes much more complicated. This is because we are in global competition and local regulation. You have to help locals compete globally, but you have much greater difficulty regulating large foreign giants, some of which may be much larger than the whole economy.
Learning to trust Market, but carry big stick In order to regulate market, you have to learn to think how the market thinks. Hence, there must be greater inter-change of staff between the regulators and the regulatees. Example: how do we regulate Hedge Funds who now account for 50%+ of turnover in London and New York? You have to learn how they operate and use the language they understand in order to influence their behaviour. Example: Fraga handling Brazilian crisis. WTO rules require regulators to use International standards to regulate financial markets. This means that we must use the Big Regulators to regulate Big Financial Groups. In order to compete regionally and globally, we must learn to both cooperate and compete with the Big Financial Groups.
Thank You Questions to as@andrewsheng.net