Download
1 / 22
220 likes | 370 Views
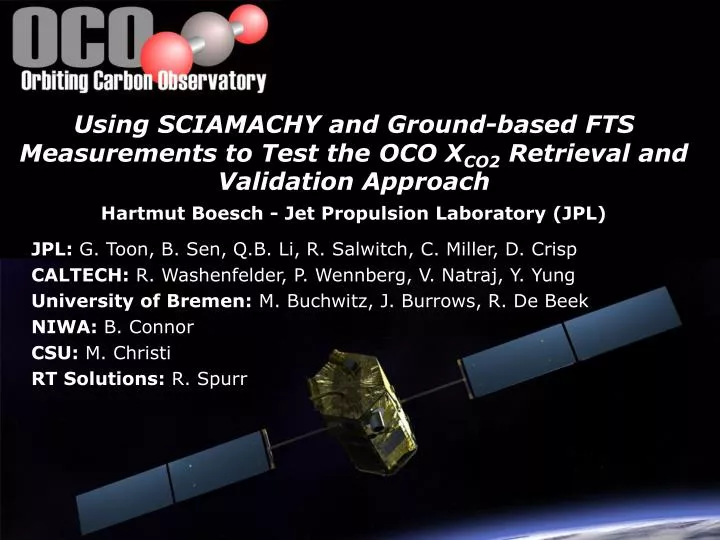
Using SCIAMACHY and Ground-based FTS Measurements to Test the OCO X CO2 Retrieval and Validation Approach Hartmut Boesch - Jet Propulsion Laboratory (JPL). JPL: G. Toon, B. Sen, Q.B. Li, R. Salwitch, C. Miller, D. Crisp CALTECH: R. Washenfelder, P. Wennberg, V. Natraj, Y. Yung

E N D
Using SCIAMACHY and Ground-based FTS Measurements to Test the OCO XCO2 Retrieval and ValidationApproach Hartmut Boesch - Jet Propulsion Laboratory (JPL) JPL: G. Toon,B. Sen,Q.B. Li, R. Salwitch, C. Miller, D. Crisp CALTECH: R. Washenfelder, P. Wennberg,V. Natraj, Y. Yung University of Bremen: M. Buchwitz, J. Burrows, R. De Beek NIWA: B. Connor CSU: M. Christi RT Solutions: R. Spurr
Space-based CO2 Measurements CO2 column 364 • Space-based measurements of column-averaged CO2 dry air mole fraction, XCO2, could dramatically improve understanding of carbon sources and sinks [Rayner & O’Brien, 2001] if • acquired globally (land/ocean) • random errors less than 1-2 ppm (0.3 – 0.5%)on regional scales to resolve • ~8 ppm pole to pole gradients • ~8 ppm seasonal cycle in Northern Hemisphere • they have no significant systematic bias on regional to continental scales Feb May CO2 Mixing Ratio (ppm) 360 Aug 356 Nov MATCH/CASA model calculation [Olsen and Randerson, 2004]
OCO Mission PARASOL - aerosols, polarization data AIRS – T, P, H2O, CO2, CH4 MODIS – cloud, aerosols, albedo CloudSat – cloud climatology CALIPSO – vertical profiles of cloud & aerosol; particle size OCO – XCO2, P(surface), T, H2O, cloud, aerosol TES – T, P, H2O, O3, CH4, CO MLS – O3, H2O, CO HIRDLS – T, O3, H2O, CO2, CH4 OMI – O3, aerosol climatology Global, space-based observations of atmospheric CO2 with precision, resolution, and coverage needed to monitor sources and sinks: • Spectra of reflected/scattered sunlight in NIR CO2 and O2 bands used to estimate XCO2 with large sensitivity near surface • A-train orbit (1:15 PM polar sun sync) • 16 day repeat cycle samples seasonal cycle on semi-monthly intervals • NASA ESSP (Earth Space System Pathfinder) scheduled for Sept 2008 launch; 2 yrs lifetime (AIRS) (OCO)
OCO Retrieval Strategy • Simultaneous fit to 3 NIR bands with sophisticated remote sensing retrieval algorithms • Forward Model computes synthetic radiance spectrum using multiple scattering RT code Radiant [M. Christi, CSU] • Inverse Method adjusts assumed state with optimal estimation technique • Column-integrated CO2 abundance • 1.61 m CO2 bands – maximum sensitivity near surface • O2 A-band and 2.06 m CO2 band - Surface pressure, albedo, atmospheric temperature, water vapor, clouds, aerosols • Self-consistent retrieval, no additional information needed CO2 2.06 m CO2 1.61m O2 A-band Clouds/Aerosols, Surface Pressure, Temperature Column CO2 Clouds/Aerosols, H2O Temperature
Validation Approach Selected Pending Global XCO2 FTS Network • OCO validation is based on network of ground-based FTS sites measuring direct sunlight: • critical test of spectroscopy:same absorption bands as OCO, but much higher spectral resolution • insensitive to aerosol or ground effects • Minimize risk of algorithmic biases:one algorithm for space- based OCO and ground-based FTS spectra • Sites represent different geophysical well characterized (aerosol, temperature etc.) regimes • Validation of FTS measurements with in-situ tower and aircraft data in order to tie FTS soundings to in-situ calibration standard [R. Washenfelder and P. Wennberg] ensures accuracy and allows to identify and to correct regional-scale biases
OCO – SCIAMACHY Comparison ENVISAT/SCIAMACHY OCO
Measurement Location • Park Falls/WI (46 N, 90 W): • Relatively homogenous region, but lake nearby • In-situ CO2 measurements from WLEF tower • FTS installed next to tower • SCIAMACHY spectra and coincident FTS spectra for SCIAMACHY overpasses (< 150 km): • Jul. - Oct. 2004 and Feb. – Aug. 2005 • SCIAMACHY spectra have been cloud- cleared (psurface > 900 mbar) 447-m tall WLEF TV transmitter tower [Courtesy of CMDL] SCIAMACHY Pixel Park Falls FTS & Tower [Courtesy of CSU]
O2 and CO2 Spectral Retrieval O2 A-band (Ch. 4, FWHM = 0.5 nm) Simplified retrieval: • CO2 vmr profile, H2O scaling • Surface pressure and albedo • Spectral shift Assumptions: • Aerosol optical depth of 0.1 • Temperature from NCEP • Neglect of polarization ILS ? ? ? 1.58 μm CO2 band (Ch. 6, FWHM = 1.5 nm) • Retrieval performs reasonable well • rms of ~ 0.5% ( 3 noise ) • Some systematic residual structures correlated with O2 • inadequate description of transfer of radiation through atmosphere and/or instrument • biases in XCO2 ?
Initial Results • Positive bias in SCIAMACHY XCO2 (~ 10 ppm) • Negative bias in surface pressure • Large scatter in space-based data due to • lower precision than FTS • variation in aerosol loading • some undetected clouds • topography (surface pressure)
Improved Results First order correction of spectral artifacts: adding 1% intensity offset to calculated O2 spectra • Largely improved comparison in XCO2 and surface pressure • No clear bias in XCO2 anymore • Standard deviation ~ 6ppm (1.6 %)
Comparison with Model • GEOS-CHEM • 20 x 2.50 with 30 vertical levels • Global emission inventories for fossil fuel and biofuel combustion, biomass burning, seasonal exchange with terrestrial biosphere, and air-sea fluxes • Model run for 2004 • Modelled CO2 profiles for Park Falls convolved with SCIAMACHY averaging kernels Correction of annual increase: XCO2 (2005) – 2 ppm • Good qualitative agreement • Underestimation of seasonal amplitude by model • Proper derivation of seasonal cycle requires averaging large number of measurements
Implications for OCO • XCO2 retrievals from SCIAMACHY look very promising (SCIAMACHY was designed to address a broad range of scientific objectives) • 2 μm CO2 band in channel 7 data will significantly improve SCIAMACHY results • OCO is a dedicated CO2 instrument with high spectral and spatial resolution MODIS Cloud Mask for Park Falls • Higher precision can be achieved by increasing spectral resolution • Spectral artifacts can be more easily identified and corrected • Small footprints increase number of cloud-free scenes • Minimizes spatial inhomogeneities (partly cloud cover, topography … )
Summary • SCIAMACHY retrievals nicely demonstrate that space-based near-infrared spectra are well-suited to infer atmospheric CO2 columns. • Initial comparison of SCIAMACHY and FTS retrievals for Park Falls: • Positive bias in XCO2 of ~ 10 ppm • Negative bias in surface pressure • After correction of spectral artifacts in O2 A band: • Largely improved agreement between SCIAMACHY and FTS XCO2 (without clear bias) and in surface pressure • Standard deviation of SCIAMACHY XCO2 ~ 6 ppm • Good qualitative agreement with GEOS-CHEM, with GEOS-CHEM underestimating seasonal cycle • OCO is a dedicated CO2 instrument and will achieve much higher accuracy and precision • much higher spectral resolution (by factor of 20) • smaller ground pixels (by factor of 600)
Acknowledgements • We thank ESA and DLR for making available SCIAMACHY Level 1 data and the Netherlands SCIAMACHY Data Center (NLSCIA-DC), maintained by KNMI and SRON, for providing us data and processing services. • We have used NCEP Reanalysis data and ECWMF ERA-40 Reanalysis data provided by the NOAA-CIRES Climate Diagnostics Center, Boulder, Colorado, USA, from their Web site at http://www.cdc.noaa.gov and by the European Centre for Medium-RangeWeather Forecasts (ECMWF), respectively. • This work was supported by the Orbiting Carbon Observatory (OCO) project through NASA's Earth System Science Pathfinder (ESSP) program. • Research at the Jet Propulsion Laboratory, California Institute of Technology, is performed under contract with the National Aeronautics and Space Administration. Related presentations by C. Miller (A14C-02) and V. Natraj et al. (A12D-06)
Summary of the linear error analysis of the SCIAMACHY retrieval Errors in XCO2 and surface pressure due to uncertainties in instrument calibration (ILS, absolute and relative gain and intensity offset) and assumed atmospheric temperature and aerosol loading and due to neglecting polarization. Parameter b gives assumed uncertainties. Day ILS Abs. gain Rel. Gain Intensity Offset T aerosol Polarization and year CH4 CH6 CH4 CH6 CH4 CH6 b 5% 5% 5% 1% 1% 1% 1% 2 K 100% - XCO2 194/04 0.4 0.4 0.3 0.07 0.01 4.3 2.4 0.08 0.1 0.01 (ppm) 284/04 1.0 0.6 0.8 0.2 0.03 6.2 3.3 0.09 0.06 1.1 104/05 1.1 0.4 1.0 0.2 0.02 6.4 3.3 0.07 0.5 1.8 psurf 194/04 1.4 0 1.4 0.3 0 16.5 0 0.9 0.9 0.1 (hPa) 284/04 3.0 0 3.0 0.6 0 19.1 0 0.8 0.8 4.0 104/05 3.2 0 3.2 0.6 0 18.9 0 0.9 1.8 6.3
Averaging Kernel • FTS and SCIAMACHY measurements have different sensitivity to atmospheric CO2 profile • SCIAMACHY averaging kernel peaks close to surface and quickly • drops with altitude • Differences are mainly result of much higher spectral resolution of FTS spectra and differences between full profile retrieval and scaling retrieval Courtesy to R. Washenfelder
FTS Retrieval • Ground-based direct sun FTS observations at Park Falls/WI (Bruker HR125) • Using updated linelists for O2 and CO2 [e.g. Toth et al.] allows excellent fit of FTS measurements • Further improvements can be achieved by using non-Voigt line shapes and including line mixing Line Mixing Not used here
Ground-based Surface Pressure Retrieval • Surface pressure retrieved from ground-based FTS measurements on July 16, 2004 for different solar zenith angles. • Shown are results when original FTS resolution is used and when FTS measurements are degraded to SCIAMACHY resolution.
Solar Fit • SCIAMACHY measures extra- terrestrial solar spectrum in NIR • Some problems with diffuser • Test of OCO solar model • Solar fit is used to optimize FWHM of ILS and continuum • Some systematic residual structures Missing solar lines ? Dead/bad pixels
OCO Retrieval Algorithm • The Level 2 Algorithm retrieves XCO2 from the calibrated radiance spectra (for aerosol< 0.3) • Same algorithm for space-based OCO and ground-based FTS instruments (validation) Minimizes risk of algorithmic biases • Must handle data from different instruments/observation geometries • 2 major components: • Forward Model: • Multiple-scattering calculation of spectrum for a given state (atmospheric and instrumental) • Computes Jacobians for all state vector elements • Uses empirical solar model • Inverse Method: • Adjusts the state vector by minimizing a posteriori cost function using a priori information (Optimal Estimation)
SCIAMACHY NIR Measurements SCIAMACHY provides space-based NIR measurements that are similar in viewing geometry to OCO, thus allows • Testing OCO Level 2 retrieval algorithm using real space-based spectra • Testing and applying OCO validation concept • Carbon/Greenhouse gas science using SCIAMACHY data
SCIAMACHY CO2 Retrieval • Spectral Bands: • O2 A-band - Channel 4, FWHM = 0.5 nm • 1.58 μm CO2 band - Channel 6, FWHM = 1.5 nm • Not used: 2 μm CO2 band in Channel 7 (FWHM = 0.22 nm) due to icing on detectors Simplified retrieval: • CO2 vmr profile • Surface pressure • H2O scaling • Surface albedo • Spectral shift Assumptions: • Aerosol optical depth of 0.1 • Temperature from NCEP • Neglect of polarization SCIAMACHY Nadir Measurements 1.61 μm OCO CO2 Band 1.58 μm CO2 Band O2 A Band