
Abstract
TP1. TP3. TP4. TP2. Assessing the Affect of RNA and cDNA Freeze-Thaw Cycling on Gene Expression using Microarray and RT-qPCR Scott Tighe, Meghan Kohlmeyer, and Tim Hunter UVM Microarray Facility and VCC DNA Analysis Facility HSRF 305 Burlington, Vermont 05405. Abstract.

Abstract
E N D
Presentation Transcript
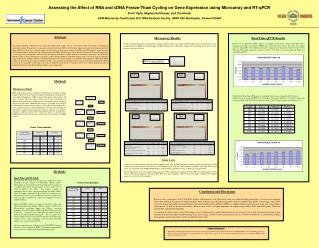
TP1 TP3 TP4 TP2 Assessing the Affect of RNA and cDNA Freeze-Thaw Cycling on Gene Expression using Microarray and RT-qPCR Scott Tighe, Meghan Kohlmeyer, and Tim Hunter UVM Microarray Facility and VCC DNA Analysis Facility HSRF 305 Burlington, Vermont 05405 Abstract Real-Time qPCR Results Microarray Results Results of the Real-Time qPCR analysis of multiple freeze thaw cycling with RNA shows insignificant changes in measured HPRT gene expression from TP1 to any other time points assessed. Using TP1 as the calibrator, the largest change in gene expression observed was between TP1 and TP6 which generated a delta Ct of 0.32. The delta Ct between TP1 and TP10 was remarkably only 0.2. Results of Agilent Bioanalyzer and microarray analysis indicates little to no change of RNA condition after all freeze thaw events as shown below in RMA-derived MVA plots and RNA integrity plots. MVA plots compare the fold change on the Y-axis to the intensity [log2]on the X-axis. The routine handling of RNA for gene expression studies often requires one or several freeze thaw events prior to downstream synthesis reactions. Because this is a common occurrence with many RNA’s used for gene expression studies in microarray and Real-Time qPCR, it is necessary to study the affects of freeze thaw cycling events on both total RNA and cDNA. In this study, both total RNA isolated from rat brain tissue and cDNA prepared from HeLa cell RNA were frozen and thawed from -20೦C to room temperature several times and subsequently analyzed using the Agilent Bioanalyzer 2100, Affymetrix microarray GeneChips, and Real-Time qPCR. Results from the Bioanalyzer, microarray, and Real-Time qPCR on total RNA indicate little to no affect on gene signatures suggesting that the stability of RNA to withstand repetitive freeze thaw episodes is remarkable. Interestingly, the Real-Time qPCR results for the freeze thaw cycling of cDNA revealed a very small but noteworthy decrease in gene detection suggesting that cDNA may be more susceptible to these types of events. It should be noted however, that these affects were nearly insignificant and are highly dependent on individual handling techniques and sample purity. TP0 Control RNA Methods Microarray Study RNA used for the microarray study was isolated from rat brain tissue using Qiagen’s RNeasy kit and evaluated using the Nanodrop spectrophotometer and Agilent Bioanalyzer 2100 to ensure high quality and stored at -80 after extraction. The freeze thaw strategy started with 6 micrograms of RNA being thawed to room temperature for 8 hour and refrozen overnight. This was repeated three additional times and 1.1 ug aliquots were removed for Bioanalyzer and microarray analysis. After collecting all samples, they were analyzed using the Agilent Bioanalyzer and processed through the Affymetrix standard target preparation synthesis protocol as a group to eliminate synthesis variation. The synthesized target was hybridized to RAE230A GeneChips for 16 hours, stained, and scanned with the GS3000 scanner. . Results of the Real-Time qPCR analysis of multiple freeze thaw cycling with cDNA shows a slight decrease in measured HPRT gene transcripts. The largest difference in measured expression was between TP1 and TP10 which results in a delta Ct of 0.54 representing a fold change of 1.54. Freeze Thaw Schedule Gene Lists Gene lists were generated for each time point compared to the Time 0 [TP0] control and sorted for genes that represent a 2-fold change up or down and had a P [presences] or M [Marginal] call using the MAS algorithm regardless of P-value. Each list of genes was submitted to the NCBI DAVID database to determine the annotation. Data are shown in each table above. Results demonstrate that in all samples only 1 gene in the TP1 sample had a significant P-value (0.037) and fold change (4.5) for the gene Piccolo-presynaptic cytomatrix protein. However, when comparing all freeze thaw time points, absolutely no common genes were affected between samples! Methods Real-Time qPCR Study The intent of this study was to mimic the sample processing occurring in the facility for Real-Time qPCR request. Investigators are often interested in measuring new transcripts on a sample(s) previously run and requires a freeze thaw cycle on either the RNA or the cDNA. This requires a sample to completely thaw to draw a subsequent aliquot for further studies. Since all samples submitted to the facility have experienced at least one freeze thaw cycle, no TP0 was assessed. Further, this study can address whether any targets are compromised due to sample handling. RNA for RTqPCR studies was isolated from HeLa cells using Trizol and purified using Qiagen’s RNeasy columns. All RNA was DNase-treated on-column during the RNeasy extraction procedure. For cDNA studies, 500ng total HeLa RNA was placed in 16 tubes. 8 samples were synthesized into cDNA using the protocol for Superscript III (Invitrogen). All 16 samples were frozen at -20C and were freeze thawed 1-10 times according to the schedule listed. Upon completion of the last thaw, the RNA samples were synthesized into cDNA. All gene expression was measured on an AB7900HT Sequence Detection System employing HPRT (hypoxanthine phosphoribyl transferease) as a medium expressing housekeeping gene. Freeze Thaw Schedule Conclusion and Discussion Based on these experiments in the UVM DNA Analysis and microarray core laboratories using our standard handling procedures, we observed insignificant freeze thaw-related gene expression changes for RNA when analyzed using Affymetrix microarray analysis and Real-Time qPCR. Interestingly, when cDNA was freeze thawed repeatedly, the measured gene expression using Real-Time qPCR for HPRT was slightly reduced each freeze thaw cycle with a total reduced expression of 1.5 fold for all ten freeze thaws. However, these results are highly dependent on sample storage buffers, RNA and cDNA purity, laboratory consumables, and individual handling. As indicated by other experts in the field, changes may be influenced by sample concentration that is extremely low or high. We did not investigate how concentration may affect RNA or cDNA during freeze thaw cycling, instead we chose concentrations that are routinely encountered in our laboratory. Studies investigating concentration affects maybe considered in future work. Acknowledgements The facility gratefully acknowledges the Vermont Cancer Center, LCCRO, Vermont Genetics Network, and NIH-NCRR for their outstanding support for the use of reagents and facilities. A special thanks goes to Russ Hovey and Josie Trott for their inspirational debate on freeze thawing mRNA which sparked the microarray study.


