Download
1 / 43
430 likes | 629 Views
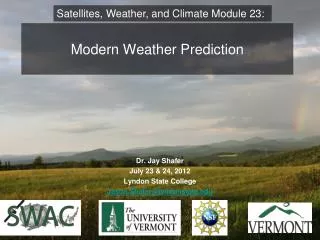
Satellites, Weather, and Climate Module 23:. Modern Weather Prediction. Dr. Jay Shafer July 23 & 24, 2012 Lyndon State College Jason.Shafer@lyndonstate.edu. V erified at St. Johnsbury , VT. If the 5-day forecast was always within 5 degrees, would this be skillful?.

E N D
Satellites, Weather, and Climate Module 23: Modern Weather Prediction Dr. Jay Shafer July 23 & 24, 2012 Lyndon State College Jason.Shafer@lyndonstate.edu
Verified at St. Johnsbury, VT If the 5-day forecast was always within 5 degrees, would this be skillful?
Skillful forecasts extend out to at least 3 days Computer power and time vs model accuracy as defined by the S1 score of 36- and 72-h NCEP 500-mb forecasts.
Did you want that coffee with sugar? No thanks, but you might want to get me a book while this model runs… Fred Shuman (left) and Otha Fuller circa 1955 at the IBM 701. The 701 was the first computer used by the JNWPU to produce operational numerical weather prediction. Harper et al. 2007: 50th Anniversary of Operational NWP http://journals.ametsoc.org/doi/pdf/10.1175/BAMS-88-5-639 http://www.ncep.noaa.gov/nwp50/
http://mesonet.agron.iastate.edu/GIS/apps/rview/warnings.phtmlhttp://mesonet.agron.iastate.edu/GIS/apps/rview/warnings.phtml
SREF Model Forecasts The SREF is the Short-Range Ensemble Forecast system; contains 20 members, each of which perturbs the initial state and/or model physics to run a suite of different solutions; statistical computations can then be done with solutions to enhance predictability.
60 Hour Forecast Valid 5:00PM Tuesday July 21, 2012 Blue line denotes predicted position of cold front: Mean sea-Level Pressure (Solid black lines, and surface wind barbs)
Overlay of cold frontal predicted positions (blue) and observed (red) Note that the cold front position falls within the large-scale pressure trough; a minimum in sea-level pressure.
33 Hour Precipitation Probability Forecast >= 0.50” Observed Precipitation In many areas over 1”, there was less than 10% chance at a short lead time. Fail! – Storms moved through faster and produced heavier rainfall in the Adirondacks and central VT.
Observed 850mb Air Temperature (deg C) 850mb is approximately 5,000’ above sea-level +20 deg C isotherm
High Temperatures Tuesday July 17, 2012 +20 deg C isotherm +20 deg C (68 F) isotherm at 850mb
Warmer south due to sunnier conditions http://weather.rap.ucar.edu/satellite/
Activity Analyze sea-level pressure, and produce your own temperature and precipitation forecasts…
Analysis • Produce a hand analysis of current sea-level pressure over the northeast U.S. • Contour isobars (lines of constant sea-level pressure) every 2 mb • 998, 1000, 1002, 1004, 1006, 1008, 1010, 1012, 1014, 1016, 1018, 1020, 1022, 1024… • Think about the large scale isobar pattern and where the cold front is located and the implications for the forecast Make your own surface map: http://vortex.plymouth.edu/sfcwx-u.html
1014 1012 1012 1014 Make your own surface map: http://vortex.plymouth.edu/sfcwx-u.html Courtesy Plymouth State University
Forecasting Words of advice • Atmosphere tends to stay in a similar state from one day to next more often than not, especially in summer -> implications are that a persistence forecast should be incorporated into the forecast • Persistence forecast: today’s weather will repeat tomorrow : current observations: http://meteorology.lyndonstate.edu/content/weather/data_localweather.php • Climatology method: First guess if you have no other information should be the climatology, or average high/low temperature….which is: • 80 deg F: High Temperature • 59 deg F: Low Temperature • Precipitation forecasting is tricky – best done probabilistically, climatology is not a good tool, recognizing the large scale pattern and understanding fundamentals that go into creating precipitation events is key….in this case we’ll try to leverage what happened on July 17 • Comparing the current forecast scenario to prior events is known as an “analog” approach, which can be quite powerful if used correctly
Temperature Forecasting • Produce an air temperature forecast for: • Highest air temperature at Lyndon State today (deg F) • Lowest air temperature at Lyndon State tonight and Tuesday AM (deg F) • Use only the information provided herein – please don’t use your smartphone or the web
Temperature Forecasting • Summer Rules of thumb (assuming little change in air mass through day): • High Temperature at Lyndon State: • Clear skies: Add 12 to 16 deg C (21 to 29 deg F) to 850mb temperature • Cloudy (opaque) skies: Add 5 to 8 deg C (9 to 15 deg F) to 850mb temperature • Widespread soaking rainfall: Similar to air temperature at 850mb • Showery rainfall/mixed cloud cover: Add 6 to 10 deg C (10 to 18 deg F) to 850mb temperature • Low Temperature: • Principal control is degree of outgoing longwave radiation, which is affected principally by the amount of water (liquid and/or vapor) in the atmosphere • Clear skies: will generally be within a few degrees of the prior evening’s dewpoint temperature; you can find the current dewpoint temperature and prior 24 hrs at: http://meteorology.lyndonstate.edu/content/weather/data_localweather.php • Cloudy skies: may only drop 5-10 degrees from the daytime high temperature
Aug 3: 5.2 Jan 2: 14.2 Aug 16: 5.1 Jan 1: 15.1 Avg Hi SD: 8.4 Avg Lo SD: 8.7 Greater variability with low temperature annually. Average High: Red Average Low: Blue One sigma from Means: Orange, Purple
850mb Temperature forecast: 5:00PM July 23, 2012 +15 deg C +15 deg C +18 deg C +18 deg C GFS Model Forecast NAM Model Forecast Images courtesy NOAA: http://mag.ncep.noaa.gov/NCOMAGWEB/appcontroller
850mb Temperature forecast: 5:00PM July 23, 2012 +16 deg C http://www.spc.noaa.gov/exper/sref/ SREF Model Forecast: Mean 850mb Temperature http://www.spc.noaa.gov/exper/sref/
Precipitation Forecasting • Produce a precipitation forecast at Lyndon for: • Probability (from 0 to 100%) of measurable precipitation through 2:00PM Tuesday • Amount of precipitation (hundredths of an inch) of precipitation now through 2:00PM Tuesday
Precipitation Forecasting • Rules of thumb: • Ingredients-based approach is best, thinking about: • Moisture availability (Has it been dry or wet?) • Lift (Is there a large-scale weather system approaching?) • Instability – How much potential or instability is present for deep updrafts/storms? • Summer rainfall tends to be scattered and showery, and not widespread, implication -> go lower on probabilities
Average Annual Precipitation and Terrain Jay Peak 63” Newport 41” Island Pond 43” East Albany 52” Mt. Mansfield 79” Burlington 36” St. Johnsbury 39” Mt. Washington 102” Montpelier 40”
SREF Moisture: Precipitable Water: 2AM Tues July 24 Moisture Plume or Atmospheric River: 1.5 to 1.75” http://www.spc.noaa.gov/exper/sref/
Lift: SREF Sea-Level Pressure forecast: 2AM Tuesday July 24 Trough axis with cold front: can expect decent lift along and ahead of this feature. http://www.spc.noaa.gov/exper/sref/
Instability: SREF CAPE 2AM July 24 CAPE 500 to 1000 J/Kg, a moderate amount for overnight… http://www.spc.noaa.gov/exper/sref/
SREF Precip Probability of 24-hr precip >= 0.25” ending 2PM Tues July 24 http://www.spc.noaa.gov/exper/sref/
SREF Precip Probability of 24-hr precip >= 0.25” ending 2PM Tues July 24 http://www.spc.noaa.gov/exper/sref/