Group Analysis
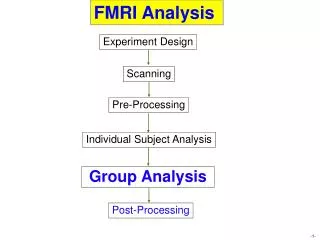
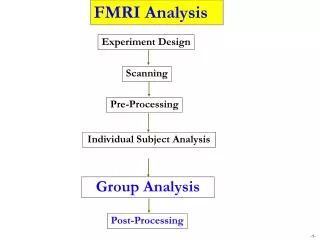
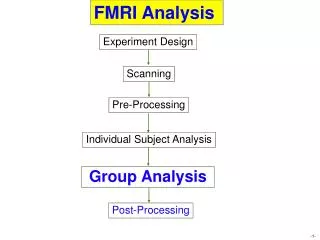
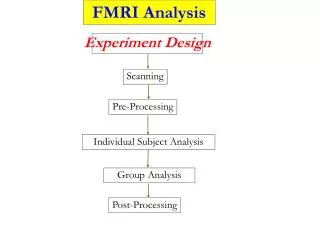
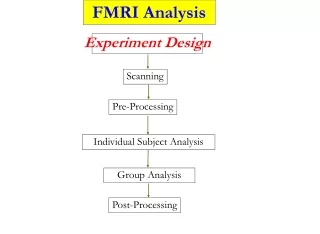
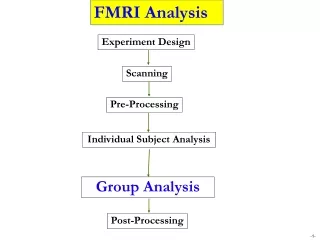
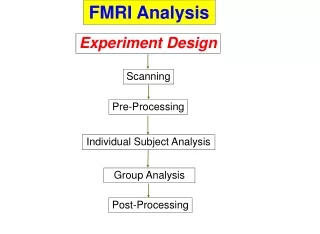
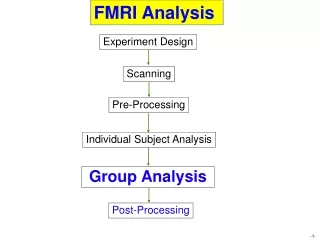
Group Analysis. File: GroupAna.pdf. Gang Chen SSCC/NIMH/NIH/HHS. FMRI Study Streamline. Experiment Design. Scanning. Pre-Processing. Individual Subject Analysis. Group Analysis. Post-Processing: clusterization, ROI analysis, connectivity, …. Preview Introduction: basic concepts

Group Analysis
E N D
Presentation Transcript
Group Analysis File: GroupAna.pdf Gang Chen SSCC/NIMH/NIH/HHS
FMRI Study Streamline Experiment Design Scanning Pre-Processing Individual Subject Analysis Group Analysis Post-Processing: clusterization, ROI analysis, connectivity, …
Preview • Introduction: basic concepts • Why do we need to do group analysis? • Factor, quantitative covariates, main effect, interaction, … • Various group analysis approaches • Regression (t-test): 3dttest++, 3dMEMA, 3dttest, 3RegAna • AN(C)OVA: 3dANOVAx, 3dMVM,GroupAna • Quantitative covariates: 3dttest++, 3dMEMA, 3dMVM, 3dLME • Complicated cases: 3dLME • Miscellaneous • Issues regarding result reporting • Intra-Class Correlation (ICC) • Nonparametric approach and fixed-effects analysis
Why Group Analysis? • Evolution of FMRI studies • Early days: no need for group analysis • Seed-based correlation for one subject was revolutionary • Now: torture brain/data enough, and hope nature will confess! • Many ways to manipulate the brain (and data) • Reproducibility and generalization • Science strives for generality: summarizing subject results • Typically 10 or more subjects per group • Exceptions: pre-surgical planning, lie detection, … • Why not one analysis with a mega model for all subjects? • Computationally unmanageable • Heterogeneity in data or experiment design across subjects
Toy example of group analysis • Responses from a group of subjects under one condition • What we have: (β1, β2, …, β10)=(1.13, 0.87, …, 0.72) • Centroid: average (β1+β2+…+β10)/10 = 0.92 is not enough • Variation/reliability measure: diversity, spread, deviation • Model building • Subject i‘s response = group average + deviation of subject i: simple model GLM (one-sample t-test) • If individual responses are consistent, should be small • How small do we consider comfortable (p-value)? • t-test: significance measure = • 2 measures: b (dimensional) and t (dimensionless)
Group Analysis Modes • Conventional: voxel-wise (brain) or node-wise (surface) • Common effects are of interest • Cross-subjects variability should be properly accounted for • Appropriate model (program) • But variability is not typically discussed • With-subject correlation should also be accounted for • Between-vs. within-subject (repeated-measures) factors • Traditionally this is handled through ANOVA: syntactic sugar • GLM and LME • Results: two components (on afni: OLay + Thr) • Effect estimates: have unit and physical meaning • Their significance (response to house significantly > face) • Very unfortunately p-values solely focused in FMRI!!!
Group Analysis Modes • Conventional: voxel-wise (brain) or node-wise (surface) • Prerequisite: reasonable alignment to some template • Limitations: alignment could be suboptimal or even poor • Different folding patterns across subjects: better alignment could help • Different cytoarchitectonic (or functional) locations across subjects: alignment won’t help! • Impact on conjunction vs. selectivity • Alternatives (won’t discuss) • ROI-based approach • Half data for functional localizers, and half for ROI analysis • Easier: whole brain reduced to one or a few numbers per subject • Model building and tuning possible
Terminology: Explanatory variables • Response/Outcome variable: regression coeficients • Factor: categorical, qualitative, nominal or discrete variable • Categorization of conditions/tasks • Within-subject (repeated-measures) factor • Subject-grouping: Group of subjects (gender, normal/patients) • Between-subject factor • Gender, patients/controls, genotypes, … • Subject: random factor measuring deviations • Of no interest, but served as random samples from a population • Quantitative (numeric or continuous) covariate • Three usages of ‘covariate’ • Quantitative • Variable of no interest: qualitative (scanner, sex, handedness) or quantitative • Explanatory variable (regressor, independent variable, or predictor) • Examples: age, IQ, reaction time, etc.
Terminology: Fixed effects • Fixed factor: categorical (qualitative or discrete) variable • Treated as a fixed variable (constant to be estimated) in the model • Categorization of conditions/tasks (modality: visual/auditory) • Within-subject (repeated-measures) factor: 3 emotions • Subject-grouping: Group of subjects (gender, normal/patients) • Between-subject factor • All levels of a factor are of interest • main effect, contrasts among levels • Fixed in the sense of statistical inferences • apply only to the specific levels of the factor • Emotions: positive, negative, neutral • Don’t extend to other potential levels that might have been included • Inferences on positive and negative emotions can’t be generated to neutral • Fixed variable: quantitative covariate
Terminology: Random effects • Random factor/effect • Random variable in the model: exclusively subject in FMRI • average + effects uniquely attributable to each subject: e.g. N(μ, τ2) • Requires enough number of subjects • Each individual subject effect is of NO interest • Group response = 0.92%, subject 1 = 1,13%, random effect = 0.21% • Random in the sense • Subjects as random samples (representations) from a population • Inferences can be generalized to a hypothetical population • A generic model: decomposing each subject’s response • Fixed (population) effects: universal constants (immutable): • Random effects: individual subject’s deviation from the population (personality: durable): bi • Residuals: noise (evanescent):
Terminology: Omnibus tests - main effect and interaction • Main effect: any difference across levels of a factor? • Interactions: with ≥ 2 factors, interaction may exist • 2 × 2 design: F-test for interaction between A and B = t-test of (A1B1 - A1B2) - (A2B1 - A2B2) or (A1B1 - A2B1) - (A1B2 - A2B2) • t is better than F: a positive t shows A1B1 - A1B2 > A2B1 - A2B2 and A1B1 - A2B1 > A1B2 - A2B2
Terminology: Interaction • Interactions: ≥ 2 factors • May become very difficult to sort out! • ≥ 3 levels in a factor • ≥ 3 factors • Solutions: reduction • Pairwise comparison • Plotting: ROI (Figures don’t lie, but liars do figure. Mark Twain) • Requires sophisticated modeling • AN(C)OVA: 3dANOVAx, 3dMVM, 3dLME • Interactions: quantitative covariates • In addition to linear effects, may have nonlinearity: x1 * x2, or x2
Terminology: Interaction • Interaction: between a factor and a quantitative covariate • Throw in an explanatory variable in a model as a nuisance regressor(additive effect) may not be enough • Model building/tuning: Potential interactions with other explanatory variables? • Of scientific interest (e.g., gender difference)
Models at Group Level • Conventional approach: taking (or linear combination of multiple ‘s) only for group analysis • Assumption: all subjects have same precision (reliability, standard error, confidence interval) about • All subjects are treated equally • Student t-test: paired, one- and two-sample: not random-effects models in strict sense as usually claimed • AN(C)OVA, GLM, MVM, LME • Alternative: taking both effect estimates and t-statistics • t-statistic contains precision information about effect estimates • Each subject is weighted based on precision of effect estimate • All models are some sorts of linear model • t-test, ANOVA, MVM, LME, MEMA • Partition each subject’s effect into multiple components
One-Sample Case • One group of subjects (n ≥ 10) • One condition (visual or auditory) effect • Linear combination of multiple effects (visual vs. auditory) • Null hypothesis H0: average effect = 0 • Rejecting H0 is of interest! • Results • Average effect at group level (OLay) • Significance: t-statistic (Thr - Two-tailed by default) • Approaches • uber_ttest.py, 3dttest++ (3dttest), 3dMEMA
One-Sample Case: Example • 3dttest++: taking only for group analysis 3dttest++ –prefix VisGroup -mask mask+tlrc \ -setA ‘FP+tlrc[Vrel#0_Coef]’ \ ’FR+tlrc[Vrel#0_Coef]’ \ …… ’GM+tlrc[Vrel#0_Coef]’ • 3dMEMA: taking and t-statistic for group analysis 3dMEMA –prefix VisGroupMEMA -mask mask+tlrc -setA Vis \ FP ’FP+tlrc[Vrel#0_Coef]’ ’FP+tlrc[Vrel#0_Tstat]’ \ FR ’FR+tlrc[Vrel#0_Coef]’ ’FR+tlrc[Vrel#0_Tstat]’ \ …… GM ’GM+tlrc[Vrel#0_Coef]’’GM+tlrc[Vrel#0_Tstat]’ \ -missing_data 0
Two-Sample Case • Two groups of subjects (n ≥ 10): males and females • One condition (visual or auditory) effect • Linear combination of multiple effects (visual vs. auditory) • Example: Gender difference in emotion effect? • Null hypothesis H0: Group1 = Group2 • Results • Group difference in average effect • Significance: t-statistic - Two-tailed by default • Approaches • uber_ttest.py, 3dttest++, 3dMEMA • One-way between-subjects ANOVA • 3dANOVA: can also obtain individual group test • 3dANOVA3: group by condition interaction
Paired Case • One groups of subjects (n ≥ 10) • 2 conditions (visual or auditory): no missing data allowed (3dLME) • Example: Visual vs. Auditory • Null hypothesis H0: Condition1 = Condition2 • Results • Average difference at group level • Significance: t-statistic (two-tailed by default) • Approaches • uber_ttest.py, 3dttest++ (3dttest), 3dMEMA • One-way within-subject (repeated-measures) ANOVA • 3dANOVA2 –type 3: can also obtain individual condition test • Missing data (3dLME): only 10 among 20 subjects have both • Essentially equivalent to one-sample case: use contrast as input
Paired Case: Example • 3dttest++: comparing two conditions 3dttest++ –prefix Vis_Aud \ -mask mask+tlrc -paired \ -setA ’FP+tlrc[Vrel#0_Coef]’ \ ’FR+tlrc[Vrel#0_Coef]’ \ …… ’GM+tlrc[Vrel#0_Coef]’ \ -setB ’FP+tlrc[Arel#0_Coef]’ \ ’FR+tlrc[Arel#0_Coef]’ \ …… ’GM+tlrc[Arel#0_Coef]’
Paired Case: Example • 3dMEMA: comparing two conditions • Contrast has to come from each subject 3dMEMA –prefix Vis_Aud_MEMA \ -mask mask+tlrc -missing_data 0 \ -setA Vis-Aud \ FP ’FP+tlrc[Vrel-Arel#0_Coef]’ ’FP+tlrc[Vrel-Arel#0_Tstat]’ \ FR ’FR+tlrc[Vrel-Arel#0_Coef]’ ’FR+tlrc[Vrel-Arel#0_Tstat]‘ \ …… GM ’GM+tlrc[Vrel-Arel#0_Coef]’’GM+tlrc[Vrel-Arel#0_Tstat]’
One-Way Between-Subjects ANOVA • Two or more groups of subjects (n ≥ 10) • One condition or linear combination of multiple conditions • Example: visual, auditory, or visual vs. auditory • Null hypothesis H0: Group1 = Group2 • Results • Average group difference • Significance: t- and F-statistic (two-tailed by default) • Approaches • 3dANOVA • > 2 groups: pair-group contrasts - 3dttest++ (3dttest), 3dMEMA • Dummy coding: 3dttest++, 3dMEMA • 3dMVM (not recommended)
Multiple-Way Between-Subjects ANOVA • Two or more subject-grouping factors: factorial • One condition or linear combination of multiple conditions • Example: gender, control/patient, genotype, handedness, … • Testing main effects, interactions, single group, group comparisons • Significance: t- (two-tailed by default) and F-statistic • Approaches • Factorial design (imbalance not allowed): two-way (3dANOVA2 –type 1), three-way (3dANOVA3 –type 1) • 3dMVM: no limit on number of factors (imbalance allowed) • All factors have two levels: uber_ttest.py, 3dttest++, 3dMEMA • Using group coding with 3dttest++, 3dMEMA: imbalance allowed
One-Way Within-Subject ANOVA • Also called one-way repeated-measures: one group of subject (n ≥ 10) • Two or more conditions: extension to paired t-test • Example: happy, sad, neutral • Main effect, simple effects, contrasts, general linear tests, • Significance: t- (two-tailed by default) and F-statistic • Approaches • 3dANOVA2 -type 3 (two-way ANOVA with one random factor) • With two conditions, equivalent to paired case with 3dttest++ (3dttest), 3dMEMA • With more than two conditions, can break into pairwise comparisons with 3dttest++, 3dMEMA
One-Way Within-Subject ANOVA • Example: visual vs. auditory condition 3dANOVA2 –type 3 -alevels 2 -blevels 10 \ -prefix Vis_Aud -mask mask+tlrc \ -dset 1 1 ‘FP+tlrc[Vrel#0_Coef]’ \ -dset 1 2 ‘FR+tlrc[Vrel#0_Coef]’ \ …… -dset 1 10 ’GM+tlrc[Vrel#0_Coef]’ \ -dset 2 1 ‘FP+tlrc[Arel#0_Coef]’ \ -dset 2 2 ‘FR+tlrc[Arel#0_Coef]’ \ …… -dset 2 10 ’GM+tlrc[Arel#0_Coef]’ \
Two-Way Within-Subject ANOVA • Factorial design; also known as two-way repeated-measures • 2 within-subject factors • Example: emotion and category (visual/auditory) • Testing main effects, interactions, simple effects, contrasts • Significance: t- (two-tailed by default) and F-statistic • Approaches • 3dANOVA3 –type 4 (three-way ANOVA with one random factor) • All factors have 2 levels (2x2): uber_ttest.py, 3dttest++, 3dMEMA • Missing data? • Break into t-tests: uber_ttest.py, 3dttest++ (3dttest), 3dMEMA
Two-Way Mixed ANOVA • Factorial design • One between-subjects and one within-subject factor • Example: gender (male and female) and emotion (happy, sad, neutral) • Testing main effects, interactions, simple effects, contrasts • Significance: t- (two-tailed by default) and F-statistic • Approaches • 3dANOVA3 –type 5 (three-way ANOVA with one random factor) • If all factors have 2 levels (2x2): 3dttest++, 3dMEMA • Missing data? • Unequal number of subjects across groups: 3dMVM, GroupAna • Break into t-tests: uber_ttest.py, 3dttest++ (3dttest), 3dMEMA • 3dLME
Group analysis with multiple basis functions • Basis functions: TENTzero, TENT, CSPLINzero, CSPLIN • Area under the curve (AUC) approach • Forget about the subtle shape difference • Focus on the response magnitude measured by AUC • Potential issues: Shape information lost; Undershoot may cause trouble • Maintaining shape information • Taking individual β values to group analysis • Basis functions of SPMG2/3 • Only take the major component to group level • Reconstruct the HRF, and take the effect estimates at the time grids to group analysis
Group analysis with multiple basis functions • Analysis with effect estimates at consecutive time grids • Used to be considered very difficult • Extra variable, Time = t0, t1, …, tk • One group of subjects under one condition • Null hypothesis H0: β1=0, β2=0, …, βk=0 (NOTβ1=β2=…=βk) • Use 3dLME or 3dMVM • Result: F-statistic for H0 and t-statistic for each time grid • Multiple groups under one condition • Use 3dANOVA3 –type 5 (two-way mixed ANOVA) or 3dMVM • Focus: do these groups have different response shape? • Null hypothesis H0: • F-statistic for the interaction between Time and Group • F-statistic for Group: AUC; F-statistic for Time: ? • Subtle shape differences: t-statistic for each time grid of each group
Group analysis with multiple basis functions • Analysis with effect estimates at consecutive time grids • One groups under multiple conditions • Use 3dANOVA3 –type 4 or 3dMVM • Focus: do these conditions have different response shape? • Null hypothesis H0: • F-statistic for the interaction between Time and Condition • F-statistic for Condition: AUC; F-statistic for Time: ? • Subtle shape differences: t for each time grid of the condition • Complicated scenarios: 3dMVM • Unequal number of subjects across groups • Comparing shape across groups and conditions simultaneously • More factors or between-subjects quantitative variables: age, IQ
More sophisticated cases? • 3dMVM • No bound on the number of explanatory variables • Three tests: UVT-UC, UVT-SC, MVT • Between-subjects covariates allowed • If all factors have two levels, run 3dttest++, 3dMEMA • Try to break into multiple t-tests: uber_ttest.py, 3dttest++, 3dMEMA • 3dLME • Within-subject covariates allowed • Missing data of a within-subject factor • Subjects are family members or even twins
Correlation analysis • Correlation between brain response and behavioral measures • Difference between correlation and regression? • Essentially the same • When explanatory and response variable are standardized, the regression coefficient = correlation coefficient • Two approaches • Standardization • Convert t-statistic to r (or determination coefficient) • Programs: 3dttest++, 3dMEMA, 3dMVM, 3dRegAna
Trend analysis • Correlation between brain response and some gradation • Linear, quadratic, or higher-order effects • Between-subjects: Age, IQ • Fixed effect • Within-subject measures: morphed images • Random effects involved: 3dLME • Modeling: weights based on gradation • Equally-spaced: coefficients from orthogonal polynomials • With 6 equally-spaced levels, e.g., 0, 20, 40, 60, 80, 100%, • Linear: -5 -3 -1 1 3 5 • Quadratic: 5 -1 -4 -4 -1 5 • Cubic: -5 7 4 -4 -7 5
Trend analysis • Correlation between brain response and some gradation • Modeling: weights based on gradation • Not equally-spaced: constructed from, e.g., poly() in R • Ages of 15 subjects: 31.7 38.4 51.1 72.2 27.7 71.6 74.5 56.6 54.6 18.9 28.0 26.1 58.3 39.2 63.5
Trend analysis • Correlation between brain response and some gradation • Modeling with within-subject trend • Run GLT with appropriate weights • Modeling with within-subject trend: 3 approaches • Set up GLT among the factor levels at group level using the weights • 3dANOVA2/3, 3dMVM • Set up the weights as the values of a variable • Needs to account for deviation of each subject • 3dLME • Run trend analysis at individual level (i.e., -gltsym), and then take the trend effect estimates to group level • Simpler than the other two approaches
Group analysis with quantitative variables • Covariate: 3 usages • Quantitative (vs. categorical) variable • Age, IQ, behavioral measures, … • Of no interest to the investigator • Age, IQ, sex, handedness, scanner,… • Any explanatory variables in a model • Variable selection • Infinite candidates: relying on prior information • Typical choices: age, IQ, RT, … • RT: individual vs. group level • Amplitude modulation: cross-trial variability at individual level • Group level: variability across subjects
Group analysis with quantitative variables • Conventional framework • ANCOVA: one between-subjects factor (e.g., sex) + one quantitative variable (e.g., age) • Extension to ANOVA: GLM • Homogeneity of slopes • Broader framework • Any modeling approaches involving quantitative variables • Regression, GLM, MVM, LME • Trend analysis, correlation analysis
Quantitative variables: subtleties • Regression: one group of subjects + quantitative variables • Interpretation of effects • α1 - slope (change rate, marginal effect): effect per unit of x • α0 – intercept: group effect while x=0 • Not necessarily meaningful • Linearity may not hold • Solution: centering - crucial for interpretability • Mean centering?
Quantitative variables: subtleties • Trickier scenarios with two or more groups • Interpretation of effects • Slope: Interaction! Same or different slope? • α0 – same or different center?
Quantitative variables: subtleties • Trickiest scenario with two or more groups
Why should we report response magnitudes? • Unacceptable in some fields if only significance is reported • Too much obsession or worship in FMRI about p-value! • Colored blobs of t-values • Peak voxel selected based on peak t-value • Science is about reproducibility • Response amplitude should be of primacy focus • Statistics are only for thresholding • No physical dimension • Once surviving threshold, specific values are not informative • Should science be based on a dichotomous inference? • If a cluster fails to survive for thresholding, there is no value? • SVC: Band-Aid solution • More honest approach: response amplitudes
Basics: Null hypothesis significance testing (NHST) • Null and alternative hypotheses • H0: nothing happened vs. H1: something happened • Dichotomous or binary decision
How rigorous about corrections? • Two types of correction • Multiple testing correction n(MTC): same test across brain • FWE, FDR, SVC(?) • People (esp. reviewers) worship this! • Multiple comparisons correction (MCC): different tests • Happy vs. Sad, Happy vs. Neutral, Sad vs. Neutral • Two one-sided t-tests: p-value is ½ of two-sided test! • How far do you want to go? • Tests in one study • Tests in all FMRI or all scientific studies? • Nobody cares the issue in FMRI • Many reasons for correction failure • Region size, number of subjects, alignment quality, substantial cross-subject variability (anxiety disorder, depression, …)
IntraClass Correlation (ICC) • Reliability (consistency, reproducibility) of signal: extent to which the levels of a factor are related to each other • Example – 3 sources of variability: conditions, sites, subjects • Traditional approach: random-effects ANOVAs • LME approach • 3dICC_REML, 3dLME
Group Analysis: Non-Parametric Approach • Parametric approach • Enough number of subjects n > 10 • Random effects of subjects: usually Gaussian distribution • Individual and group analyses: separate • Non-parametric approach • Moderate number of subjects: 4 < n < 10 • No assumption of data distribution (e.g., normality) • Statistics based on ranking or permutation • Individual and group analyses: separate
Group Analysis: Fixed-Effects Analysis • When to consider? • LME approach • Group level: a few subjects: n < 6 • Individual level: combining multiple runs/sessions • Case study: difficult to generalize to whole population • Model βi = b+εi, εi ~ N(0, σi2), σi2: within-subject variability • Fixed in the sense that cross-subject variability is not considered • Direct fixed-effects analysis (3dDeconvolve/3dREMLfit) • Combine data from all subjects and then run regression • Fixed-effects meta-analysis (3dcalc) : weighted least squares • β = ∑wiβi/∑wi, wi = ti/βi = weight for ith subject • t = β√∑wi
Non-Parametric Analysis • Ranking-based: roughly equivalent to permutation tests • 3dWilcoxon (~ paired t-test) • 3dFriedman(~ one-way within-subject with 3dANOVA2) • 3dMannWhitney(~ two-sample t-test) • 3dKruskalWallis(~ between-subjects with 3dANOVA) • Pros: Less sensitive to outliers (more robust) • Cons • Multiple testing correction limited to FDR (3dFDR) • Less flexible than parametric tests • Can’t handle complicated designs with more > 1 fixed-effects factor • Can’t handle covariates • Permutation approach?
Group Analysis Program List • 3dttest++(one-sample, two-sample and paired t) + covariates (voxel-wise) • 3dMEMA(R package for mixed-effects analysis, t-tests plus covariates) • 3ddot(correlation between two sets) • 3dANOVA (one-way between-subject) • 3dANOVA2 (one-way within-subject, 2-way between-subjects) • 3dANOVA3 (2-way within-subject and mixed, 3-way between-subjects) • 3dMVM(AN(C)OVA, and within-subject MAN(C)OVA) • 3dLME(R package for sophisticated cases) • 3dttest(mostly obsolete: one-sample, two-sample and paired t) • 3dRegAna(obsolete: regression/correlation, covariates) • GroupAna(mostly obsolete: Matlab package for up to four-way ANOVA)