Acids Lesson 18 Titration Curves
90 likes | 382 Views
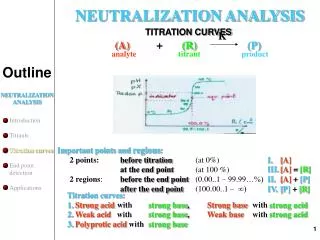
Acids Lesson 18 Titration Curves. Titration Curves A titration curve is a graph of the pH changes that occur during an acid-base titration versus the volume of acid or base added.

Acids Lesson 18 Titration Curves
E N D
Presentation Transcript
Acids Lesson 18 Titration Curves
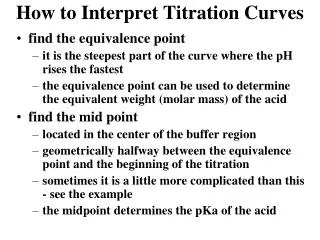
Titration Curves A titration curve is a graph of the pHchanges that occur during an acid-base titration versus the volumeof acid or base added. The equivalencepointis the end of a titration where the stoichiometryof the reaction is exactly satisfied, or molesH+ = moles OH-. The transition pointrefers to when an indicator changes color and [HInd] = [Ind-].
Choosing an Indicator When you choose an indicator, you must pick one so that the transitionpointof the indicator matches the equivalence pointof the titration. Rule of thumb Salt Equivalence Point Neutral7 Basic9 Acidic5
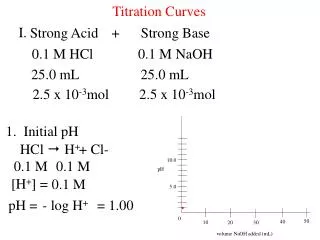
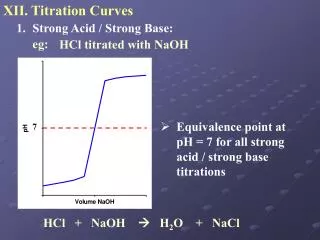
1. Titration Curve: Strong Acid and Strong Base HCl + KOH → KCl + HOH neutral salt Indicator pH = 7Bromothymol Blue- seepage 7 50 mL of 0.10 M KOH is added to 25 mL of 0.10 M HCl 0 25 50 pH 14 7 0 Volume .10 M KOH added We start here The pH of 0.10 M HCl is 1.0 The pH of 0.10 M KOH is 13.0 0.10 M KOH 0.10 M HCl Neutral Salt pH = 7.0
2. Titration Curve: Weak Acid and Strong Base HCN + KOH → KCN + H2O basic salt IndicatorpH = 9Phenolphthalein-seepage 7 20 mL of 1.0 M HCN is added to 10 mL of 1.0 M KOH 0 10 20 pH 14 7 0 Volume 1.0 M HCN added is added to We end here pH = 3 We start here pH = 14 1.0 M KOH Basic Salt pH = 9 1.0 M HCN
0 30 60 pH 14 7 0 Volume 1.0 M NH3 added 3. Titration Curve: Strong Acid and Weak Base HCl + NH3 → NH4+ + Cl- acid salt IndicatorpH = 5Methyl Red- see page 7 60 mL of 1.0 M NH3 is added to 30 mL of 1.0 M HCl 1.0 M NH3pH 10 Acid Salt pH 5 1.0 M HCl pH = 0
4. Match the Curve with the Reaction 50 0 25 pH 14 7 0 Volume .10 M KOH added A. 3HCl + Al(OH)3 → AlCl3 + 3HOH B. HCl + KOH → KCl + HOH C. HCN + KOH → KCN + HOH
5. Match the Curve with the Reaction 0 30 60 pH 14 7 0 Volume 1.0 M NH3 added A. 3HCl + Al(OH)3 → AlCl3 + 3HOH B. HCl + KOH → KCl + HOH C. HCN + KOH → KCN + HOH
6. Match the Curve with the Reaction 0 30 60 pH 14 7 0 Volume 1.0 M NH3 added A. 3HCl + Al(OH)3 → AlCl3 + 3HOH B. HCl + KOH → KCl + HOH C. HCN + KOH → KCN + HOH