TITRATION CURVES
NEUTRALIZATION ANALYSIS. TITRATION CURVES. K (A) + (R) (P) analyte titrant product. Outline. NEUTRALIZATION ANALYSIS. Introduction Titrants Titration curves End point detection Applications. Important points and regions : 2 points: before titration (at 0%) I. [ A ]

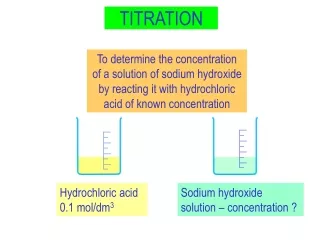
TITRATION CURVES
E N D
Presentation Transcript
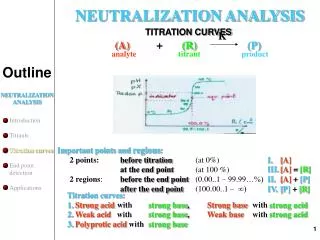
NEUTRALIZATION ANALYSIS TITRATION CURVES K (A) + (R)(P) analytetitrant product Outline NEUTRALIZATION ANALYSIS • Introduction • Titrants • Titration curves • End point detection • Applications Important points and regions: 2points:before titration (at 0%) I. [A] at the end point (at 100 %)III. [A]= [R] 2 regions: before the end point (0.00..1 – 99.99…%) II.[A] + [P] after the end point (100.00..1 – ∞) IV. [P]+ [R] Titration curves: 1.Strong acidwith strong base,Strong basewithstrong acid 2.Weak acidwithstrong base,Weak basewithstrong acid 3.Polyprotic acidwith strong base
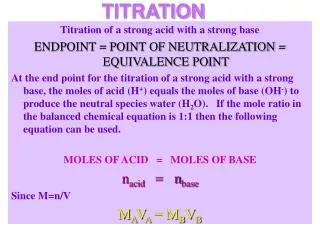
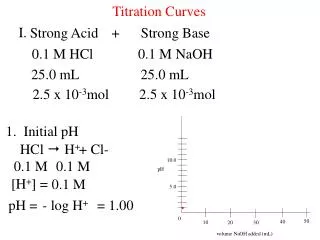
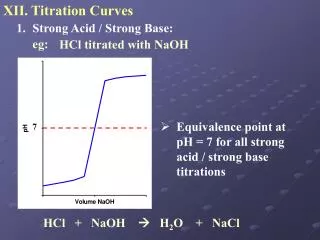
TITRATION CURVES 1.Strong acidwith strong base,Strong basewithstrong acid Outline NEUTRALIZATION ANALYSIS HCl + NaOH Cl– + Na+(H2O) acid1 + base2 base1 + acid2 (very weak) e.g. • Introduction • Titrants • Titration curves • End point detection • Applications • At the start: [H+] = [H3O+]=[HCl]0 [OH–] = [NaOH]0 pH = – lg [HCl]0 pOH = – lg [NaOH]0pH = 14 – pOH • Before the end point: • [H+] = [H3O+]=[HCl]unreacted [OH–] = [NaOH]unreacted • pH = – lg [HCl]unreacted pOH = – lg [NaOH]unreacted • At the end point: • [H+] ≡ [OH–] • KW = 10–14pH ≡ 7 • After the end point: • [OH–] = [NaOH]excess [H+] = [H3O+]=[HCl]excess • pOH = – lg [NaOH]excesspH = – lg [HCl]excess
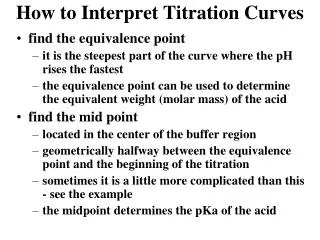
TITRATION CURVES Titration curves: 1. Strong acidwith strong base,Strong basewith strong acid 2.Weak acidwithstrong base,Weak basewithstrong acid 3.Polyprotic acid with strong base EFFECTS ON THE TITRATION CURVE: 1. Effect of the temperature: Outline 25°C[H+]·[OH–] = Kw = 10–14Neutr. point: pH = 7 NEUTRALIZATION ANALYSIS 100°C[H+]·[OH–] = Kw = 10–12Neutr. point: pH = 6 • Introduction • Titrants • Titration curves • End point detection • Applications 0 100
EFFECTS ON THE TITRATION CURVE 2. Dependence on the initial concentrations (e.g. [HCl]): Outline pH change around the end point NEUTRALIZATION ANALYSIS ΔpH 3– 11 4 – 10 5 – 9 6 – 8 • Introduction • Titrants • Titration curves • End point detection • Applications 100 0
EFFECTS ON THE TITRATION CURVE 3. Dependence on the acid strength (dissociation constants): A. Weak acidwith strong bases , 0 100 Outline e.g.10–1 NCH3COOHis titrated with NaOH (Ka = 2x10⁻⁵) NEUTRALIZATION ANALYSIS • Introduction • Titrants • Titration curves • End point detection • Applications ΔpH pKInd ≈ 9→ PHENOLPHTALEIN B.Weak basewithstrong acid e.g.10–1 NNH4OH is titrated withHCl (Kb = 2x10⁻⁵) ΔpH pKInd ≈ 5 → METHYL RED
TITRATION CURVES II. Weak acidwith strong base Weak basewithstrong acid e.g.Titration ofCH3COOHwith NaOH , Titration ofNH4OH withHCl: I. At the start: pH Weak acid Weak base II. Before the end point: pH Buffer (acid / salt) Buffer (base / salt) Outline NEUTRALIZATION ANALYSIS III. At the end point: pH • Introduction • Titrants • Titration curves • End point detection • Applications Hydrolysing salt (Brönsted base) Hydrolysing salt (Brönsted acid) IV. After the end point: pH Excess of strong acid Excess of strong base [H+] = Cexcess acid [OH–] = Cexcess base [OH–] = [NaOH]excess [H+] = [HClexcess
TITRATION CURVES III. Polyprotic acidwith strong base e.g.Titration of H3PO4with NaOH • H3PO4 + OH–H2PO4– + H2O Ka1 = 7x10⁻³ • H2PO4–+OH– HPO42–+H2O Ka2 = 6x10⁻⁸ • 3.HPO42–+ OH– PO43– + H2O Ka3 = 10–12 Outline NEUTRALIZATION ANALYSIS • Introduction • Titrants • Titration curves • End point detection • Applications
ACID / BASE INDICATORS • Azo-compounds Genearal structure: Outline NEUTRALIZATION ANALYSIS Mechanism: • Introduction • Titrants • Titration curves • End p. detection • - chemical • - instrumental • Applications Yellow (basic) (aromatic) Yellow (intermediate) (protonated) Red (acidic) (quinoid)
ACID / BASE INDICATORS • PHTHALEIN-derivatives General structure: Outline NEUTRALIZATION ANALYSIS Mechanism: Thymol blue • Introduction • Titrants • Titration curves • End p. detection • - chemical • - instrumental • Applications Colorless (intermediate) Colorless (acidic) Purple (basic)
INSTRUMENTAL DETECTION (Summary) The titration process is followed by electrochemical, photometric or other sensing devices. Outline INSTRUMENTAL DETECTION • Advantages • Types • Potentiometric end point detection • Conductometric end point detection
POTENTIOMETRY Electrode potential developed between: Indicator electrode Reference electrode • Potential (Eind) varies • Depends on the analyte concentration • Known, constant potential (Eref) • Independent of the analyte concentration Outline Common reference electrodes: Solid metal / its „unsoluble” salt / saturated conc. of anion INSTRUMENTAL DETECTION e.g. Ag / AgCl / KCl Hg / Hg2Cl2 / KCl Hg / Hg2SO4 / K2SO4 • Advantages • Types • Potentiometric end point detection • Conductometric end point detection Nernst equation: Glass electrode Neutralization titration: E = E0 + 0.059 lg [H+] Metal electrode 0.059 n Complexometric titration: E = E0 + lg [Mn+] Ion-selective electrode Precipitation titration: E = E0 + 0.059 lg [X−] Nobel metal electrode [ox] [red] 0.059 n Redox titration: E = E0 + lg
POTENTIOMETRYNeutralization analysis Indicator electrode: External reference electrode Glass electrode GLASS ELECTRODE Outline INSTRUMENTAL DETECTION H+ conc. to be determined Electrochemical cell for measurement of pH: • Advantages • Types • Potentiometric end point detection • Conductometric end point detection Internal| buffer sol. | (KCl) (pH = 7) | External reference || electrode || (Hg/Hg2Cl2/KCl) || H+ conc. | to be | determined| pH-sensitive | glass- | membrane| Internal reference electrode (Ag/AgCl/KCl) ███████████ ExternalDry glass Internal hydrated hydrated gel layer gel layer
POTENTIOMETRYGlass electrode Composition of glass: E.g. 22 % Na2O, 6 % CaO, 72 % SiO2. Na+ mobile membrane solution Outline H+ Na+ Ion-exchange reaction: between H+in the solution and Na+ in the glass: H+ Na+ H+ Na+ INSTRUMENTAL DETECTION K H+ + Na+Gl−Na+ + H+Gl–K = LARGE! solutionglasssolution glass • Advantages • Types • Potentiometric end point detection • Conductometric end point detection Combination glass electrode:
POTENTIOMETRYTitration curve Potentiometric titration curve: Measuring the potential of a suitable indicator electrode (pH) as a function ofvolume titrant. Titration curve Outline INSTRUMENTAL DETECTION 1st derivative Determination of the end point:from thederivatives • Advantages • Types • Potentiometric end point detection • Conductometric end point detection 2nd derivative
CONDUCTOMETRIC TITRATION CURVES I. Titration of strong acid(a) with strong base e.g. HClwith NaOH (b)with weak base e.g. HClwith NH4OH Outline INSTRUMENTAL DETECTION % • Advantages • Types • Potentiometric end point detection • Conductometric end point detection II. Titration of weak acid(c) with strong basee.g. CH3COOHwith NaOH (d)withweak base e.g. CH3COOHwith NH4OH %
APPLICATIONS TITRATIONS Direct Back (indirect): Outline Analyte Titrant in excess to measure to calculate NEUTRALIZATION ANALYSIS I. Determination ofstrong acids/ bases: Equivalence point:pH = 7 e.g. NaOH • Introduction • Titrants • Titration curves • End point detection • Applications OH− H2O Vphen. Vmeth.r.
APPLICATIONS • Determination ofweakacids : Equivalence point:pH > 7 (phenolphtalein indicator) weak bases : Equivalence point:pH < 7 (methyl red indicator) II. (a) Determination of weakacids : Ka ≥ 10–5. (10–7- 10–4) Outline e.g. carboxylic acids of low carbon atoms e.g. CH3COOH Direct: fatty acids (e.g. fat, wax, oil) NEUTRALIZATION ANALYSIS Back : if the weak acid is volatile e.g. CO2(as carbonate or hydrogencarbonate) • Introduction • Titrants • Titration curves • End point detection • Applications bubble-free distillation CO2 known amount of Ba(OH)2 back titration of excessBa(OH)2 with standard HCl Distillation apparatus (Maros- Schulek) Application of CO2 determination: Determinationof organic materials Determination of CO2, HCO3– , CO32– content of natural waters • Nonaqueous solvents: Ka < 10–7 > 10–12
APPLICATIONS II. (b)Determination of weak bases : Kb ≥ 10–5 (10–7- 10–4) Direct: e.g. NH4OH strong base (NaOH) Back:NH4+ -salt NH3 boiling Outline distillation into known excess of acid Kjeldahl method: back titration of excess acid (HCl) with basic titrant (NaOH) NH3 NEUTRALIZATION ANALYSIS known HCl Application of NH3 determination: N-containing organic compounds (e.g. amino acids, proteins,…) • Introduction • Titrants • Titration curves • End point detection • Applications Decomposition (mineralization)with cc. H2SO4, 300 °C + catalyst: Se, or Cu2+ Ox. number:– 3 (NH4)2SO4 (e.g.. – NH2, –N(CH3)2, =NH, –N<) Ox. number:+ 3, +1HNO3(+5) (e.g.,azo- (-N=N-), nitro-, nitrozo comp.) Reduction with Zn, Na2S2O4,.. NH4+ • Nonaqueous solvents: Kb < 10–7 > 10–12
APPLICATIONS III.Determination of salts: (a) Neutral salts: NOT MEASURABLE! (b) Salt hydrolyzing to acid: Brönsted acid (strong acid + weak base) MA + H2O MOH + A– + H+ Outline if pK > 7! can be TITRATED with base E.g. Aniline · HCl; Benzidine ·H2SO4; Papaverine · HCl… (c) Salt hydrolyzing to base: Brönsted base (strong base + weak acid) NEUTRALIZATION ANALYSIS MA + H2O HA + M+ + OH– if pK > 7 can be TITRATED with acid E.g.Na2B4O7 (B4O72– +7 H2O 4H3BO3 + 2OH–) methyl red • Introduction • Titrants • Titration curves • End point detection • Applications E.g. Na2CO3 (CO32– + H2O HCO3– + OH–) phenolpht. (CO32– +2 H2O H2CO3 +2 OH–) methyl red NaHCO3 (HCO3– + H2O H2O + CO2 +OH–) methyl red Na2CO3 NaHCO3 HCO3− H2CO3 CO32− HCO3− H2CO3 Vphen = 0 Vphen Vmeth.r. Vmeth.r.
APPLICATIONS (d) Specific determinations: NaOH – Na2CO3 in the presence of each other NaHCO3– Na2CO3 in the presence of each other Outline NEUTRALIZATION ANALYSIS OH−, CO32− HCO3− H2CO3 CO32−HCO3− HCO3− H2CO3 Vphen Vphen Vmeth.r. Vmeth.r. Warder’s method : • Introduction • Titrants • Titration curves • End point detection • Applications one sample : Warder’s method : A. OH– + H+ H2O phenolpht. two samples : CO32– + H+ HCO3–. B. HCO3– + H+ H2CO3methyl red A. CO32– + H+ HCO3–phenolpht.. two samples : B. OH− + H+ H2O CO32– +2H+ H2CO3 B. HCO3– + H+ H2CO3 CO32− +2H+ H2CO3 methyl red methyl red Winkler’s method : A. + BaCl2 CO32– +Ba2+ BaCO3 OH– + H+ H2O phenolpht.