Download
1 / 47
510 likes | 1.03k Views
Titration Curves. Titration Curves A titration curve is a graph of the pH changes that occur during an acid-base titration versus the volume of acid or base added. There are three types of titration curves.

E N D
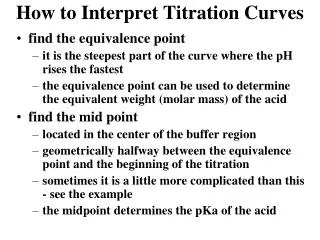
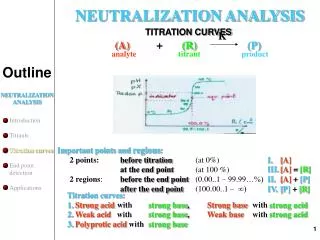
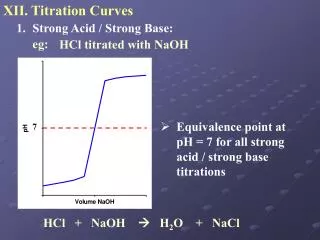
Titration Curves A titration curveis a graph of the pHchanges that occur during an acid-base titration versus the volumeof acid or base added. There are threetypes of titration curves. You need to be able to recognize each and then choose a suitable indicator for that titration. The equivalencepoint is the end of a titration where the stoichiometryof the reaction is exactly satisfied, or molesH+ = moles OH-. The transition point refers to when an indicator changes color and [HInd] = [Ind-].
Choosing an Indicator When you choose an indicator, you must pick one so that the transition point of the indicator matches the equivalence point of the titration. When acid base titration is at the equivalence point, the acid has neutralized the base leaving only a salt and water. The pH of the equivalence point depends on type of salt. Rule of thumb If the salt is neutral the equivalence point = 7 If the salt is basic the equivalence point = 9 If the salt is acidic the equivalence point = 5
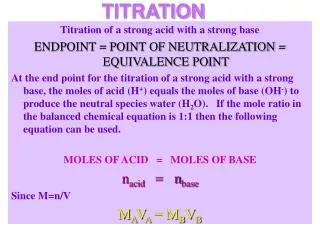
1.Titration Curve:Strong Acid and Strong Base HCl + KOH →
1.Titration Curve:Strong Acid and Strong Base HCl + KOH →KCl + HOH
1.Titration Curve:Strong Acid and Strong Base HCl + KOH →KCl + HOH Indicator
1.Titration Curve:Strong Acid and Strong Base HCl + KOH → KCl + HOH Indicator pH = 7Bromothymol Blue
1.Titration Curve:Strong Acid and Strong Base HCl + KOH → KCl + HOH Indicator pH = 7 Bromothymol Blue 50 mL of 0.10 M KOH is added to 25 mL of 0.10 M HCl
0 25 50 pH 14 7 0 Volume .10 M KOH added 1.Titration Curve:Strong Acid and Strong Base HCl + KOH → KCl + HOH Indicator pH = 7 Bromothymol Blue 50 mL of 0.10 M KOH is added to 25 mL of 0.10 M HCl
0 25 50 pH 14 7 0 Volume .10 M KOH added 1.Titration Curve:Strong Acid and Strong Base HCl + KOH → KCl + HOH Indicator pH = 7 Bromothymol Blue 50 mL of 0.10 M KOH is added to 25 mL of 0.10 M HCl 0.10 M HCl
0 25 50 pH 14 7 0 Volume .10 M KOH added 1.Titration Curve:Strong Acid and Strong Base HCl + KOH → KCl + HOH Indicator pH = 7 Bromothymol Blue 50 mL of 0.10 M KOH is added to 25 mL of 0.10 M HCl 0.10 M HCl Neutral Salt
0 25 50 pH 14 7 0 Volume .10 M KOH added 1.Titration Curve:Strong Acid and Strong Base HCl + KOH → KCl + HOH Indicator pH = 7Bromothymol Blue 50 mL of 0.10 M KOH is added to 25 mL of 0.10 M HCl 0.10 M KOH 0.10 M HCl Neutral Salt
0 25 50 pH 14 7 0 Volume .10 M KOH added 1.Titration Curve:Strong Acid and Strong Base HCl + KOH → KCl + HOH Indicator pH = 7Bromothymol Blue 50 mL of 0.10 M KOH is added to 25 mL of 0.10 M HCl
0 25 50 pH 14 7 0 Volume .10 M KOH added 1.Titration Curve:Strong Acid and Strong Base HCl + KOH → KCl + HOH Indicator pH = 7Bromothymol Blue 50 mL of 0.10 M KOH is added to 25 mL of 0.10 M HCl
2.Titration Curve:Weak Acid and Strong Base HCN + KOH →
2.Titration Curve:Weak Acid and Strong Base HCN + KOH → KCN + HOH
2.Titration Curve:Weak Acid and Strong Base HCN + KOH → KCN + HOH Indicator
2.Titration Curve:Weak Acid and Strong Base HCN + KOH → KCN + HOH Indicator pH = 9Phenolphthalein
2.Titration Curve:Weak Acid and Strong Base HCN + KOH → KCN + HOH Indicator pH = 9Phenolphthalein 20 mL of 1.0 M HCN is added to 10 mL of 1.0 M KOH
0 10 20 pH 14 7 0 Volume 1.0 M HCN added 2.Titration Curve:Weak Acid and Strong Base HCN + KOH → KCN + HOH Indicator pH = 9Phenolphthalein 20 mL of 1.0 M HCN is added to 10 mL of 1.0 M KOH
0 10 20 pH 14 7 0 Volume 1.0 M HCN added 2.Titration Curve:Weak Acid and Strong Base HCN + KOH → KCN + HOH Indicator pH = 9Phenolphthalein 20 mL of 1.0 M HCN is added to 10 mL of 1.0 M KOH 1.0 M KOH
0 10 20 pH 14 7 0 Volume 1.0 M HCN added 2.Titration Curve:Weak Acid and Strong Base HCN + KOH → KCN + HOH Indicator pH = 9Phenolphthalein 20 mL of 1.0 M HCN is added to 10 mL of 1.0 M KOH 1.0 M KOH Basic Salt
0 10 20 pH 14 7 0 Volume 1.0 M HCN added 2.Titration Curve:Weak Acid and Strong Base HCN + KOH → KCN + HOH Indicator pH = 9Phenolphthalein 20 mL of 1.0 M HCN is added to 10 mL of 1.0 M KOH 1.0 M KOH Basic Salt 1.0 M HCN
0 10 20 pH 14 7 0 Volume 1.0 M HCN added 2.Titration Curve:Weak Acid and Strong Base HCN + KOH → KCN + HOH Indicator pH = 9Phenolphthalein 20 mL of 1.0 M HCN is added to 10 mL of 1.0 M KOH 1.0 M KOH Basic Salt 1.0 M HCN
0 10 20 pH 14 7 0 Volume 1.0 M HCN added 2.Titration Curve:Weak Acid and Strong Base HCN + KOH → KCN + HOH Indicator pH = 9Phenolphthalein 20 mL of 1.0 M HCN is added to 10 mL of 1.0 M KOH
0 10 20 pH 14 7 0 Volume 1.0 M HCN added 2.Titration Curve:Weak Acid and Strong Base HCN + KOH → KCN + HOH Indicator pH = 9Phenolphthalein 20 mL of 1.0 M HCN is added to 10 mL of 1.0 M KOH Buffer Zone
0 10 20 pH 14 7 0 Volume 1.0 M HCN added 2.Titration Curve:Weak Acid and Strong Base HCN + KOH → KCN + HOH Indicator pH = 9Phenolphthalein 20 mL of 1.0 M HCN is added to 10 mL of 1.0 M KOH Buffer Zone Weak Acid & Salt are present
3.Titration Curve:Strong Acid and Weak Base HCl + NH3 →
3.Titration Curve:Strong Acid and Weak Base HCl + NH3 → NH4+ + Cl-
3.Titration Curve:Strong Acid and Weak Base HCl + NH3 → NH4+ + Cl- Indicator
3.Titration Curve:Strong Acid and Weak Base HCl + NH3 → NH4+ + Cl- Indicator pH = 5Methyl Red
3.Titration Curve:Strong Acid and Weak Base HCl + NH3 → NH4+ + Cl- Indicator pH = 5Methyl Red 60 mL of 1.0 M NH3 is added to 30 mL of 1.0 M HCl
0 30 60 pH 14 7 0 Volume 1.0 M NH3 added 3.Titration Curve:Strong Acid and Weak Base HCl + NH3 → NH4+ + Cl- Indicator pH = 5Methyl Red 60 mL of 1.0 M NH3 is added to 30 mL of 1.0 M HCl
0 30 60 pH 14 7 0 Volume 1.0 M NH3 added 3.Titration Curve:Strong Acid and Weak Base HCl + NH3 → NH4+ + Cl- Indicator pH = 5Methyl Red 60 mL of 1.0 M NH3 is added to 30 mL of 1.0 M HCl 1.0 M HCl
0 30 60 pH 14 7 0 Volume 1.0 M NH3 added 3.Titration Curve:Strong Acid and Weak Base HCl + NH3 → NH4+ + Cl- Indicator pH = 5Methyl Red 60 mL of 1.0 M NH3 is added to 30 mL of 1.0 M HCl 1.0 M HCl Acid Salt
0 30 60 pH 14 7 0 Volume 1.0 M NH3 added 3.Titration Curve:Strong Acid and Weak Base HCl + NH3 → NH4+ + Cl- Indicator pH = 5Methyl Red 60 mL of 1.0 M NH3 is added to 30 mL of 1.0 M HCl 1.0 M NH3 1.0 M HCl Acid Salt
0 30 60 pH 14 7 0 Volume 1.0 M NH3 added 3.Titration Curve:Strong Acid and Weak Base HCl + NH3 → NH4+ + Cl- Indicator pH = 5Methyl Red 60 mL of 1.0 M NH3 is added to 30 mL of 1.0 M HCl 1.0 M NH3 1.0 M HCl Acid Salt
0 30 60 pH 14 7 0 Volume 1.0 M NH3 added 3.Titration Curve:Strong Acid and Weak Base HCl + NH3 → NH4+ + Cl- Indicator pH = 5Methyl Red 60 mL of 1.0 M NH3 is added to 30 mL of 1.0 M HCl
0 30 60 pH 14 7 0 Volume 1.0 M NH3 added 3.Titration Curve:Strong Acid and Weak Base HCl + NH3 → NH4+ + Cl- Indicator pH = 5Methyl Red 60 mL of 1.0 M NH3 is added to 30 mL of 1.0 M HCl Buffer Zone Weak Base & Salt are present
4. Match the Curve with the Reaction 0 25 50 pH 14 7 0 Volume .10 M KOH added A. 3HCl + Al(OH)3 → AlCl3 + 3HOH B. HCl + KOH → KCl + HOH C. HCN + KOH → KCN + HOH
4. Match the Curve with the Reaction 0 25 50 pH 14 7 0 Volume .10 M KOH added Bisect the verticle pH = 7 A. 3HCl + Al(OH)3 → AlCl3 + 3HOH B. HCl + KOH → KCl + HOH C. HCN + KOH → KCN + HOH
4. Match the Curve with the Reaction Bisect the verticle pH = 7 0 25 50 pH 14 7 0 Volume .10 M KOH added A. 3HCl + Al(OH)3 → AlCl3 + 3HOH B. HCl + KOH → KCl + HOH C. HCN + KOH → KCN + HOH
5. Match the Curve with the Reaction 0 30 60 pH 14 7 0 Volume 1.0 M NH3 added A. 3HCl + Al(OH)3 → AlCl3 + 3HOH B. HCl + KOH → KCl + HOH C. HCN + KOH → KCN + HOH
5. Match the Curve with the Reaction 0 30 60 pH 14 7 0 Volume 1.0 M NH3 added Bisect the verticle pH = 5 A. 3HCl + Al(OH)3 → AlCl3 + 3HOH B. HCl + KOH → KCl + HOH C. HCN + KOH → KCN + HOH
6. Match the Curve with the Reaction 0 30 60 pH 14 7 0 Volume 1.0 M NH3 added A. 3HCl + Al(OH)3 → AlCl3 + 3HOH B. HCl + KOH → KCl + HOH C. HCN + KOH → KCN + HOH
6. Match the Curve with the Reaction Bisect the verticle pH = 9 0 30 60 pH 14 7 0 Volume 1.0 M NH3 added A. 3HCl + Al(OH)2 → AlCl3 + 3HOH B. HCl + KOH → KCl + HOH C. HCN + KOH → KCN + HOH
6. Match the Curve with the Reaction Bisect the verticle pH = 9 0 30 60 pH 14 7 0 Volume 1.0 M NH3 added A. 3HCl + Al(OH)2 → AlCl3 + 3HOH B. HCl + KOH → KCl + HOH C. HCN + KOH → KCN + HOH