Download
1 / 11
110 likes | 191 Views
Explore the impacts of dam-induced daily river stage fluctuations on a gravel bar in the Colorado River near Austin, Texas. Analyzing groundwater dynamics and flow patterns using ArcGIS mapping. Preliminary results show groundwater mirroring surface water fluctuations. Ongoing data collection and analysis to create water table maps and potentially include temperature data.

E N D
Effects of Dam-Induced Daily River Stage Fluctuations on a Large Gravel Bar Blair Stanley November 18, 2008
Outline • Introduction • Objective • Methods • Progress to Date • Preliminary Results and Conclusions • To Do
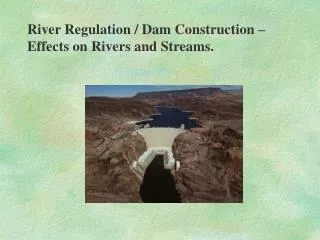
Introduction • Dams alter hydrogeology • Storage of water, sediment, and nutrients • Ecosystems (biogeochemistry) • Contaminants (dilution or intensification) • Change Channel hydraulics
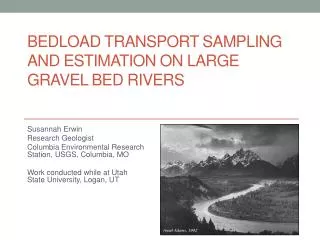
Introduction: Study Site • Hornsby Bend Island • Colorado River southeast of Austin, Texas • Large gravel bar with riparian forest • Severely modified hydrograph
Objective • How have dams affected the discharge within the Colorado River near Hornsby Bend Island? • How do regulated stage fluctuations affect flow patterns within Hornsby Bend Island? • Main Objective: • Analyze groundwater dynamics • Capture fluctuations in the water table • Couple groundwater and surface water data with ArcGIS
Methods • Monitor discharge values from the USGS • Monitor head distributions from probes on island • Locate piezometers using: • Differential Global Positioning System • Total Station Surveyor • Upload groundwater and surface water data to ArcGIS • Contour water table elevations using data interpolation http://www.nysgis.state.ny.us/outreach/gist/images07/base_1.jpg
Progress to Date • USGS data collected and uploaded • National Water Information System • Pressure-transducer data collected and being analyzed • Piezometer locations obtained and being uploaded
Progress to Date • Capitol Area Council of Governments • Orthoimagery downloaded and uploaded • Hydrography data downloaded and uploaded
Preliminary Results & Conclusions • Groundwater fluctuations mimic surface water fluctuations
To Do • Process water table elevation data with time • Upload data into ArcGIS • Create water table maps • Incorporate temperature data (if time permits)