Download
1 / 37
370 likes | 515 Views
Climate Change Human-induced effects and/or natural fluctuations?. Alberto Montanari - University of Bologna - alberto.montanari@unibo.it. Why to study climate change is important??. Water resources management – Water Framework Directive Evaluation of future water resources availability

E N D
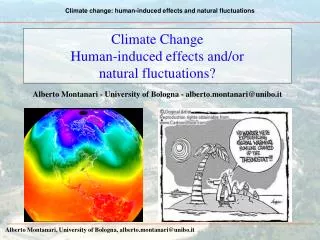
Climate ChangeHuman-induced effects and/or natural fluctuations? Alberto Montanari - University of Bologna - alberto.montanari@unibo.it
Why to study climate change is important?? • Water resources management – Water Framework Directive • Evaluation of future water resources availability • Design of measures for contrasting water scarcity (water management policies, artificial reservoirs). • Implementation of economical policies. • Design of water distribution networks • Evaluation of future water demands. • Assessment of hydrological risk • Assessment of future flood flows. • Design of river engineering works. • Design of civil protection measures.
Climate change is a controversial issue….. Despite of what the media tell us, detection of climate change is subject to a relevant uncertainty. Climate is surely changing, but…. • Scientific questions (often not mentioned by • the media): • Is the climate change irreversible or is it just a temporary fluctuation? • If it is a temporary fluctuation, how long is it? • Climate change is a human-induced effect or a natural variation? • These scientific questions have relevant • economic and social implications – Much • more relevant than what we can imagine! • Remember: climate is changing for sure!
A practical example - 1 • Water resources management – Water Framework Directive • In order to meet the demands of the Water Framework Directive, regional administrations in Italy have to prepare a master plan for water management. • In the Emilia-Romagna region, the master plan has to propose efficient solutions for mitigating the impacts due to the release of the environmental flow. • Water resources managers are undergoing a political pressure in order to substantiate the necessity of a huge dam on a Appennine River, that should accumulate water during the winter to assure water for irrigation and environmental flow during the summer. • Politicians say that the dam is needed because we cannot withdraw water from the Po River anymore, because climate change is reducing the Po river flows. However….
The “Official” Warming Estimates (U.N. Intergovernmental Panel on Climate Change) A first scientific example – Global warming due to greenhouse effects Computerized climate models have led to future warming estimates by 2100 of from 1.1 to 2.9 deg. C (low emissions) to 2.4 to 6.4 deg. C (high emissions).. Direct surface warming from 2xCO2 is only 0.6 deg C (about 1 deg. F) Thus, climate models have net POSITIVE feedbacks (they respond to a warming tendency with changes that amplify the 1 deg. F CO2-only warming). There is a WIDE range of warming estimates, illustrating substantial uncertainty (mainly from cloud feedback differences between models)
Why warming estimates could be overly pessimistic. • The Earth’s greenhouse effect is mostly due to water vapor and clouds, which are under the control of weather processes (mostly precipitation systems). • A few percent increase in low clouds, or a small increase in precipitation efficiency, could entirely offset the warming tendency from carbon dioxide (neither of these processes are well understood). • Big Question: Do precipitation systems stabilize the Earth’s temperature at a preferred temperature?
Most of our atmosphere is being continuously recycled by precipitation systems, which then determine the strength of the Greenhouse Effect Cooling (loss of IR radiation) by dry air to space Heat released through condensation causes air to rise, rain falls to surface Air sinks in response to precipitation systems: Sinking air is relatively dry Sunlight absorbed at surface Boundary layer warm, humid air cool, dry air evaporation removes heat Ocean or Land
Climate Models do not yetcontain the processes that stabilize the climatesystem against significant warming. MOST of these stabilizing processes can probably be traced to “thermostatic” effects of precipitation systems, which adjust global water vapor and cloud amounts to maintain a natural Greenhouse Effect and temperatures that depend upon how much sunlight is available. Bottom Line: How much you believe climate model predictions of future warming depends upon how much faith you have that the models contain all of the important atmospheric processes (feedbacks) that determine how the atmosphere responds to greenhouse gas forcing.
A second scientific example - The Hockey stick controversy http://en.wikipedia.org/wiki/Hockey_stick_controversy Mann et al. 1998. McIntyre and McKitrick, 2005; See http://www.realclimate.org and http://www.climateaudit.org.
A second scientific example - The Hockey stick controversy Manipulation operated by the Media (Uncertain results given as certain…..)
A second scientific example - The Hockey stick controversy Manipulation operated by the Media (Presentation of partial results…..)
The famous Mann et al. “Hockey Stick” had errors in statistical analysis methods. (A National Academies Review Panel [July 2006] changed the Hockey Stick conclusion from “warmest in 1,000 years” to “warmest in 400 years”) McIntyre-McKitrick, 2003
We are probably not as warm as during Medieval Warm Period The GRIP (Greenland) borehole record is one of the best records because it is not a proxy, it is a DIRECT measure of temperature. Shown are the last 2000 years. (Dahl-Jensen et al. 1998, Science, 282, 268-271 "Past Temperatures Directly the Greenland Ice Sheet"). A similar reconstruction occurs for the Ural Mountain borehole temperatures (i.e. warmer 1000 years ago, Bemeshko, D., V.A. Schapov, Global and Planetary Change, 2001.
Climate change Manipulation operated by the Media (Catastrophic views…..)
Climate change Manipulation operated by the Media (Catastrophic views…..)
Climate change Is it possible to gain an impartial view???
A fundamental starting point: the IPCC fourth assessment report The Intergovernmental Panel on Climate Change (IPCC) has been established by World Meteorological Organisation (WMO) and UNEP (United Nations Environment Programme) to assess scientific, technical and socio- economic information relevant for the understanding of climate change, its potential impacts and options for adaptation and mitigation. It is currently finalizing its Fourth Assessment Report "Climate Change 2007", also referred to as AR4. The reports by the three Working Groups provide a comprehensive and up-to-date assessment of the current state of knowledge on climate change.
IPCC fourth assessment report http://www.ipcc.ch/SPM13apr07.pdf
The IPCC fourth assessment report Independent Summary for Policy Makers
The IPCC fourth assessment report Independent Summary for Policy Makers The growth rate of CO2 emissions (in carbon equivalent) is equal to or slightly below the growth rate of world population (see Figure ISPM-2). Global per capita carbon emissions peaked at 1.23 tonnes per person in 1979 and the per-person average has declined slightly since then. As of 2003 the global average is 1.14 tonnes per capita, an average that has not changed since the early 1980s. If this trend continues, global emissions growth in the future will be constrained by total population growth.
The IPCC fourth assessment report Independent Summary for Policy Makers - Sun If the sun does have a strong effect on climate, this adds importance to recent projections that solar output is likely to decline over the next several decades (e.g., Zhen-Shan, 2007)
The IPCC fourth assessment report Independent Summary for Policy Makers - Temperature Problems with the surface temperature record Research on the nature of the surface thermometer network has cast some doubt on the claim of the IPCC that the surface temperature record is free of biases related to non-climatic effects, such as land-use change, urbanization and changes in the number of stations worldwide. For example, studies have shown that the spatial pattern of warming trends over land correlate strongly with the distribution of industrial activity, even though such a correlation is not predicted by climate models (e.g., de Laat and Maurellis 2004, 2006). Urban heat island effect
The IPCC fourth assessment report Independent Summary for Policy Makers Temperature
The IPCC fourth assessment report Independent Summary for Policy Makers - Precipitation • There is no globally-consistent pattern in long-term precipitation trends. • At the global level, slight decline was observed in total precipitation from 1950 to the early 1990s, which has since reversed. • Precipitation in North and South America has risen slightly over the past century in many places, though in some regions it has fallen. • The drying trend noted in the 1980s in the Sahel (the coastal region in Africa bordering the Sahara desert) has since reversed considerably. • Rainfall in India increased from 1901 to 1979 then declined through to the present and there is no overall trend. Australian precipitation trends vary by region and are closely linked to the El Niño cycle. • Perceptions of increased extreme weather events are potentially due to increased reporting. There is too little data to reliably confirm these perceptions.
The IPCC fourth assessment report Independent Summary for Policy Makers – Sea level • Regional trends in sea level are quite varied and some regions are experiencing declining sea levels. Changes in air pressure and wind account for some observed sea level increase. • While global sea level rose by approximately 120 metres during the several millennia that followed the end of the last glacial maximum, the level stabilized between 3000 and 2000 years ago. Since then, paleo sea level indicators suggest that global sea level did not change significantly: the average rate of change from 2000 years ago to about 100 years ago is near zero. • Although regional variability in coastal sea level change had been reported from tide gauge analyses, the global coverage of satellite altimetry provides unambiguous evidence of non-uniform sea level change in open oceans. • For the past decade, the western Pacific Ocean and eastern Indian Oceans show the highest magnitude of sea level rise, however, sea level has been dropping in the eastern Pacific and western Indian Oceans.
The IPCC fourth assessment report Independent Summary for Policy Makers – Sea level • Except for the Gulf Stream region, most of the Atlantic Ocean shows sea level rise during the past decade. • Sea level increases over the past decade are not uniform, and it is presently unclear whether they are attributable to natural variability. • The instrumentally-based estimates of modern sea level change provide evidence for an onset of acceleration at the end of the 19th century. Recent estimates for the last half of the 20th century (1950.2000) give approximately 2 mm/year global mean sea level rise. • New satellite observations show that since 1993 sea level has been rising at a rate of 3.1 mm/year. • Satellite data also confirm that sea level is not rising uniformly over the world. • It is presently unclear whether the higher rate of sea level rise in the 1990.s indicates an acceleration due to global warming, or a result of natural climate variability, or a combination of both effects.
The IPCC fourth assessment report Independent Summary for Policy Makers Snow and Glacier • Most archives from the Northern Hemisphere and the tropics show small or absent glaciers between 9,000 and 6,000 years ago. • Glaciers began growing thereafter, up to the 1800s. This tendency is primarily related to changes in the Earth’s orbit. However shorter, decadal-scale, regionally diverse glacier responses must have been driven by other factors which are complex and poorly understood. • General retreat of glacier termini started after 1800, with considerable mean retreat rates in all regions after 1850 lasting throughout the 20th century. A slowdown of retreats between about 1970 and 1990 is evident in the raw data. Retreats were again generally rapid in the 1990s; though advances of glaciers have been observed in western Scandinavia and New Zealand. • There are few records of directly measured glacier mass balances, and they stretch back only to the mid 20th century. When areal weighting and spatial interpolation are used to estimate large-scale patterns from the available data, the 1990s trend towards glacier retreat appears to have leveled off or reversed after 1998.
The IPCC fourth assessment report Independent Summary for Policy Makers - Paleoclimate The earth was ice-free during most of its history. The Pliocene (about 3 million years ago) was the most recent time in Earth’s history when mean global temperatures were substantially warmer (about 2°C to 3°C warmer). On the other hand, temperatures during most of the most recent 1 million years (the Pleistocene) have been colder than at present. Long glacial periods have alternated with short (10 to 30,000 year long) interglacials. Globally, there was less glacial ice and higher sea level on Earth during the Last Interglacial than now. This suggests significant meltback of the Greenland and possibly Antarctica ice sheets occurred. The climate of the LIG has been inferred to be warmer than present, although the evidence is regional and not neccessarily synchronous globally. The causes of large-scale climate variations on the century and longer time scales are not well-understood.
The IPCC fourth assessment report Independent Summary for Policy Makers – Climate models The output and the projections of climate models are highly uncertain. Climate models are calibrated. Some observational data do not concur with the output of climate models. Different models provide different outcomes with a wide spread.
The IPCC fourth assessment report Independent Summary for Policy Makers – The attribution problem The climate is subject to natural variability over a wide range of time scales Internal variability and irreversible change are difficult to distinguish (if not impossible, given the present state of the knowledge). The current level of uncertainty in climate studies prevents to reach statistically significant conclusions.
The IPCC fourth assessment report Independent Summary for Policy Makers – Conclusions The climate in most places has undergone minor changes over the past 200 years, and the land-based surface temperature record of the past 100 years exhibits warming trends in many places. Measurement problems, including uneven sampling, missing data and local land-use changes, make interpretation of these trends difficult. Other, more stable data sets, such as satellite, radiosonde and ocean temperatures yield smaller warming trends. The actual climate change in many locations has been relatively small and within the range of known natural variability. There is no compelling evidence that dangerous or unprecedented changes are underway.