
GPS-Based Snow Depth Measurement: A Study from Minnesota 2010-2011
This study utilizes GPS Interferometric Reflectometry (GPS-IR) to develop a new snow depth product for Minnesota during the 2010-2011 winter. It highlights the benefits of a large regional GPS network for measuring snow depth, including accurate local variability, time and magnitude of snowfall, and snowmelt rates. By employing data from continuously operating reference stations (CORS), the study demonstrates effective signal interference methods to capture precise snow measurements. This innovative approach informs winter weather models and may enhance forecast accuracy.

GPS-Based Snow Depth Measurement: A Study from Minnesota 2010-2011
E N D
Presentation Transcript
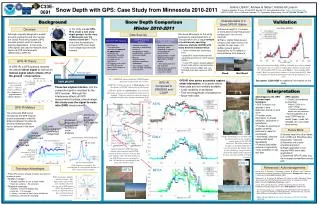
Snow Depth with GPS: Case Study from Minnesota 2010-2011 C33E- 0691 Andria L Bilich1, Andrew G Slater2, Kristine M Larson31National Geodetic Survey, NOAA/NOS, Boulder CO; corresponding author: andria.bilich@noaa.gov 2NSIDC/CIRES, Univ of Colorado, Boulder CO; 3Aerospace Engineering, Univ of Colorado, Boulder CO Characteristics of a Good GPS-IR Station Background Snow Depth Comparison Winter 2010-2011 Validation Overview In this study, we use GPS-IR to create a new snow depth product for the state of Minnesota over the winter of 2010-2011. This is one of the first studies to compute GPS snow depth over a large regional-scale network. • Antenna height of 1.5 meters or more above snow-free ground surface [taller if lots of snow expected] • Flat or slightly titled ground surface [snow height retrieval error negligible for slope angles < 5] • Bare ground lacking obstructions for 50 meters or more distance from antenna Data Sources • We chose Minnesota for this study because the state Department of Transportation runs a large network of continuously operating reference stations (CORS) with many desired characteristics: • freely available data (anonymous FTP) • good GPS station distribution with reasonable proximity to COOP weather stations • many GPS stations located adjacent to farm fields with few sky obstructions • Trimble receiver models with L2C SNR data (best data source for GPS-IR) Although originally designed to enable accurate positioning and time transfer, the Global Positioning System (GPS) has also proved useful for remote sensing applications. In this study, GPS signals are used to measure snow depth via GPS interferometricreflectometry (GPS-IR). GPS-IR Theory Data collected at Niwot Ridge LTER in Colorado, at a 3,500-m altitude alpine tundra site. Gray dots are independent estimates of daily tracks for GPS satellite PRN 05, due south. Black is 7-day smoothed GPS results. Red is terrestrial laser scanner, co-located with the GPS. Blue are manual snow depth measurements collected approximately every week. See poster C33A-0620 for additional information on this study. In GPS-IR, a GPS antenna receives the desired direct signal as well as an indirect signal which reflects off of the ground / snow surface. Direct signal Good Not Good Reflected signal SD = SNOWDAS, shown both at the COOP location and at the location of the GPS station. COOP observations are shown as black squares, with the distance to COOP station given in plot legend. GPS snow depths are colored circles; we provide the daily mean value of several satellites present at a given azimuth. Colored vertical bars show the range of individual satellite observations contributing to the mean. 1 in. • GPS-IR time series accurately capture snow information, in locations where these data are not normally available: • Local variability in snowpack • Time and magnitude of snowstorms • Snow melt rates SNOW GPS-IR Compared to SNODAS and COOP Interference is the key to GPS-IR. Direct + reflected creates oscillations whose frequency is proportionate to reflector distance. bare ground These two signals interfere, and the composite signal is recorded by the GPS receiver. Although this interference affects all GPS measurements (phase, pseudorange), this study uses the signal-to-noise ratio (SNR) measurement. ASHL MRTA EMLY ASHL N N N Interpretation 2 in. GPS-IR Method • Advantages to the GPS-IR snow depth technique: • GPS inversion only requires 1-time calibration based on land cover • Provides snow information for model validation, calibration or assimilation • Provides an estimate of spatial variability; particularly useful for assimilation • Automated, objective method with direct repeatability • Potential nationwide network of opportunity • Data available in near real-time • GPS caveats: • Careful site selection is important • Many CORS are in urban settings • Seasonal vegetation effects can be significant • Not all satellites at a rural CORS may be useful (trees, roads, tall hillsides, etc. can create obstructions) The composite SNR signal recorded by the GPS receiver is post-processed to yield the distance between the antenna and the reflecting surface, that is, distance to the snow surface. Looking West Google Earth imagery is overlain with the first Fresnel zone for satellites used to generate the GPS-IR timeseries. The zones assume an average 2-m antenna height abive snow-free ground. The largest zones are for satellite at 5 deg elevation, whereas the smaller zones represent the area sensed by satellite at 10 deg elevation. Future Work 50 cm snow • Assess data from other states, both CORS and Plate Boundary Observatory networks • Automate into a semi-operational product • Begin applications (e.g. improve NWS snow data assimilation) • Determine GPS-IR utility (e.g. via increased streamflow forecast skill) spring Location map for COOP observing stations (grey triangles) and GPS-IR stations (colored circles). Circle size and color indicate when L2C data streams for the GPS-IR stations were activated in 2011. All stations are operational for the 2011-2012 winter season. Reflected component of SNR in spring and summer, PRN12 at ASHL. Looking South summer MRTA EMLY Peak frequency returned by the periodogram is converted into distance to snow surface and snow depth. References / Acknowledgements Technique Advantages Larson, K.M., E. Gutmann, V. Zavorotny, J. Braun, M. Williams, and F. Nievinski, Can We Measure Snow Depth with GPS Receivers?, Geophys. Res. Lett., 36, L17502, doi:10.1029/2009GL039430, 2009 Gutmann, E., K. M. Larson, M. Williams, F.G. Nievinski, and V. Zavorotny, Snow measurement by GPS interferometricreflectometry: an evaluation at Niwot Ridge, Colorado, Hydrologic Processes, in press Larson, K.M. and F.G. Nievinski, GPS Snow Sensing: Results from the EarthScope Plate Boundary Observatory, GPS Solutions, under review. • Free GPS stations already installed, operating for another purpose • Spatial coverage • Multiple satellites & arcs at each station • Each arc samples ~ 50 sq meters • Temporal coverage • Satellites rise/set throughout day • Each arc ~ 2 hr average • Latency – minutes to hours (after all data for satellite pass have been recorded) Reflection points indicate spatial coverage. This figure shows all possible L2C satellites observed over one day at GPS station ASHL. Each satellite is viewed at a different time of day, creating temporal coverage as well. The reflections group at CU is supported by NSF EAR 0948957, NSF AGS 0935725; AES is supported by NOAA grant NA11OAR4310142. We thank MN-DOT, especially Blaine McKeever, for providing the raw GPS data files. Please see our website at http://xenon.colorado.edu/reflections for more information. Looking North Looking West


