Download
1 / 67
670 likes | 704 Views
Learn about duration as a key risk measure in asset liability management, measuring holding-period risk, its history, calculations, and practical applications.

E N D
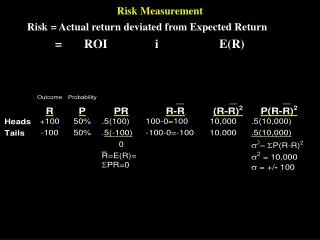
Risk Measurement and Management Week 11 –November 2, 2006
Measuring Holding-Period Risk • Price sensitivity of bonds is measured in terms of a bond price elasticity • This elasticity is called durationdenoted d1, which is widely used by bond traders and analysts and is often available on quote sheets
Example of Duration • Assume a 10-year 8% coupon bond is priced at 12% yield to maturity and has value of 77.4 and duration of 6.8 • If yields changed immediately from 12% to 10%, that is a 2/112 or 1.8% change in gross yield • The bond price should change about 1.8% * 6.8 = 12.1%
19-4 Duration as Time Measure • In 1930’s, Macauley noted that maturity was not relevant measure of timing of payments of bonds and defined his own measure, duration • The definition of duration is (19-4):
Duration has two interpretations • Elasticity of bond prices with respect to changes in one plus the yield to maturity • Weighted average payment date of cash flows (coupon and interest) from bonds • Duration measure • Can be modified to be a yield elasticity by dividing by (1+yield to maturity) • can be redefined using term structure of yields (Fisher-Weil duration noted d2)
Duration Calculations • Duration can be calculated for bonds: • For level-payment loans (e.g. mortgages):
Duration is an Approximation Derivative is used in calculating duration Price (Par=1.0) Actual price change Change predicted by duration 0 Yield to Maturity
Properties of Duration • Can be interpreted as price elasticity or weighted average payment period • Note when c=0 that d1= M • When M is infinite d1= (1+i)/i • Duration measure effect of parallel shift in interest rates • Other economic risks are not assessed
Duration as Risk Measure • Good • Balances reinvestment yield risk against capital gains risk • Widely used and clear mathematical expression assessing holding-period yield risk • Bad • Approximation and theoretical issues • Convexity adjustment only approximate improvement
Asset Liability Management:Definitions • Approach to balance sheet management including financing and balance sheet composition and use of off-balance sheet instruments • Assessment or measurement of balance sheet risk, especially to interest rate changes • Simulation of earnings performance of a portfolio or balance sheet under a variety of economic scenarios
History of ALM • After World War II to mid 1960’s • ASSET MANAGEMENT • Interest rates stable, large post-war holdings of government bonds, deposit markets protected • Mid 1960’s to late 1970’s • LIABILITY MANAGEMENT • Interest rates rising, global financial markets developing (e.g. Eurodollars), regulation binding (maximum deposit interest rates)
History of ALM (continued) • Late 1970’s to present • ASSET/LIABILITY MANAGEMENT • Use balance sheet composition or off-balance sheet instruments to management interest rate and other economic risks • Changing markets - increased competition from non-banks, foreign institutions • Goverment concerns - S&L failures, Continental Bank and Texas banks, etc.
Measurement of Risk of Balance Sheet • Maturity gaps are common way to assess the sensitivity of a balance sheet to changes in interest rates • Assets and liabilities classified by maturity or repricing interval • Cumulative gap calculated • Not easy to interpret in terms of risk
Duration of Balance Sheet • Duration of a number of assets is • Duration of net worth in a portfolio is
Simulation • Computer simulation can handle more complex economic changes • Many simulations can assess sensitivity of earnings to changes • Regulators require and consultants can apply
Managing Interest Rate Risk • Change balance sheet composition • Adjust assets and liabilities until dE is at acceptable level • Use futures or options to adjust next exposure • What is source of value added?
Can Risk Management Add Value? • Return to risk-free portfolio is the risk-free rate • Investors can manage their own interest rate risk • Does risk distract management or prevent exploitation of competitive advantage? • Pleasing regulators and better understanding may be biggest advantage of ALM
Risk Management • Balance sheet management • ALM • Duration and immunization • Off balance sheet • Futures • Options • Swaps
Types of Derivative Contracts • Three basic types of contracts • Futures or forwards • Options • Swaps • Many basic underlying assets • Commodities • Currencies • Fixed incomes or residual claims
Managing Risk with Futures • Offset price or interest rate risk with contract which moves in opposite direction • “Cross diagonally in the box” • Identify contract with price or interest rate which moves as close as possible with the price or interest rate exposure • Imperfect correlation is basis risk • Not using futures or forwards can be speculation
Bank Planning to Borrow Hedging Insurance Hedge Borrowing Hedge Insurance Company with Premiums
Interest-Rate Options • Interest rates and asset values move in opposite directions • Long cash means short assets • Short cash means long (someone else’s) asset • Basis risk comes from spreads between exposure and hedge instrument • Problem with production risk
Caps, floors, and collars • If a borrower has a loan commitment with a cap (maximum rate), this is the same as a put option on a note • If at the same time, a borrower commits to pay a floor or minimum rate, this is the same as writing a call • A collar is a cap and a floor
Collars: Cap 6%, floor 4% Profit 0 9400 9500 9600 Loss
Options and Product Pricing • Option pricing is well established technology • Black-Scholes approaches • Present value approaches • Simulation • In interest rates, lattice models used which are consistent with interest rate movements • Can model any cash flow with combinations of options “Rocket Science”
Replication Futures with Options Profit Profit Buy Call Long 0 0 P0 P0 Loss Loss Write Put
Other option developments • Credit risk options • Casualty risk options • Requirements for developing an option • Interest • Calculable payoffs • Enforceable
Swaps • Exchange of future cash flows based on movement of some asset or price • Interest rates • Exchange rates • Commodity prices or other contingencies • Swaps are all over-the-counter contracts • Two contracting entities are called counter-parties • Financial institution can take both sides
Interest Rate Swap:Plain vanilla, LIBOR@5.5% 1/2 5% fixed Company A (receive floating) Company B (receive fixed) $2.5mm $2.75mm 1/2 6-month LIBOR Notional Amount $100 mm
Issues in Hedging • Micro-hedging versus macro-hedging • Accounting • Regulation • Assumptions underlying hedging • Market liquidity • Covariance structure (second moments) • Notorious examples • PNC, IG Metall, Bankers Trust, Orange Cy, Long-Term Capital Mgmt (LTCM), BancOne
Overview of Credit Risk • Usual interpretation of credit risk is default on a loan or bond • New views of credit risk are focused on the change in the credit-worthiness of debt instruments as well as default • Risk changes will be reflected in the value of a portfolio over time as write-downs or downgrades short of default reduce value of claims (mark-to-market view of risk)
Default • Private debt (corporate and household) may not pay cash flows as promised • Late payments • Nonpayment of interest or principal • Other default or credit events • Violation of covenants and other creditor interventions in operations • Change in risk of default (e.g. highly leveraged transactions)
Credit Events • Probability of default (PD) can change affecting the value of default-risky securities • Upgrades and downgrades reflecting changes in PD are credit events • Recent progress has been made in quantifying these probabilities
Bond and Debt Ratings • Rating agencies • Standard and Poor’s (AAA to D) • Moody’s (Aaa to C) • Fitch and Duff and Phelps • Migration of ratings, e.g. from BBB to BB (investment grade to below investment grade) represents credit risk • For example, change from BBB to BB has historical probability of 5.3% (S&P, 1996)
Risk of Fixed Incomes Probability Maximum value=F Future Value of Debt
Credit Losses • Three elements in credit losses • Estimated default probability (PD) • Loss given default (LGD) • Exposure at default (EAD) • Credit losses = PD*LGD*EAD • Investors in debt securities will be concerned about all these elements in managing their risks
Credit Risk Analysis • Credit risk has become a major focus of rating agencies, regulators, and investors • Very important to capital market development (e.g. asset securitizations, loan syndications) • Enron, Global Crossing, and GE exemplify different stages of concern with these issues • Consulting industry in credit analysis • RiskMetrics (formerly J.P. Morgan) • KMV (academic based research) • Others (KPMG, PricewaterhouseCoopers, etc.)
Credit Risk Assessment • Default occurs when value of assets less than value of liabilities (insolvency) • Example of analysis used by KMV uses simplified estimates of variables • Must calculate market value of assets (market value of debt and equity) and variability of market value • Identify book value of liabilities
Motorola: Debt and Equity Total Market Value
Distance to Default: Example • Motorola 2001-II (billions) Value of long-term debt = $ 7.3Book value of current liabilities = 12.9 Total value of liabilities = $20.2 Market value of assets = $56.6 Standard deviation of change in market value = 16.4% • Market value standard deviation of percent change = $9.3 billion
Reduced Probability of Default? • Estimated default point in example is midway between book value of current liabilities and long-term debt • Theory is that long-term debt does not require immediate payment, short-term liabilities may allow some flexibility • KMV uses historical data to fine-tune this estimate
Estimated Distance to Default Market value to default point = $40.0 $20.2 $56.6 $12.9 CL CL+LTD TMV Default point (estimated as midpoint) = $16.6
Distance to Default: 12-31-01 • Total Value of Assets (from “Capital Structure” and Financial Statements):E + LTD + CL = TA$33.9 + $ 8.1 + $9.7 = $ 51.7 • Book value of LTD and CL $8.4 and $9.7Midpoint estimate of default point = $13.9Std Dev = 16.4% * $51.7 = $8.48
Probability of Default • KMV has used historical data to relate distance from default to probability of default • That measure is proprietary (not available) • As example, Motorola is rated A3 by Standard and Poors, historically associated with a default rate of about .82% over next five years (.61% in Moody’s experience)
Private Firm Default Risk • KMV estimates non-traded firm risk by using market-traded comparables • Data base on 35,000 traded firms globally • Valuations of private firms and risk estimated by using EBITDA/Assets ratios • KMV estimates default probabilities for private firms based on data on 300,000 firms in 30 countries • Estimates depend on EBITDA0
Credit Risk in Portfolios • Individual assets have probability of default and risk and discussed last week • Loans in portfolios will have an interdependent risk structure due to correlations in defaults • Credit risk within portfolio context is a major advance in credit risk management • Search for a summary measure of portfolio risk led to the concept of value at risk
Value at Risk(VAR) • Value at risk (VAR) looks at risk of portfolio accounting for covariance of assets • Risk is defined in terms of likelihood of losses
VAR and Capital B Capital
Portfolio Credit Risk • Credit risk different than usual portfolio risk analysis • Returns are not symmetric • Concentrations of exposure complicate losses • Major issue is correlation of defaults and losses given default • We will discuss approach followed by CreditMetrics • Other approaches exist (including KMV)