Download
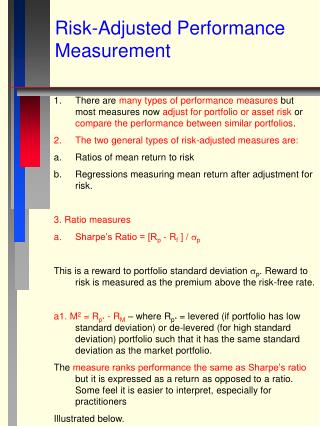
1 / 33
340 likes | 590 Views
Banks at Cross-Roads. Integrated Risk Management and Performance Measurement. Process Reengineering. Project Management. Technical Infrastructure. IPM Solution Set - Integrated Performance Measurement. SVM. EP. RAPM. Economic Capital. Operating Profit. Op. Risk. Cr. Risk. Mkt.

E N D
Banks at Cross-Roads Integrated Risk Management and Performance Measurement
Process Reengineering Project Management Technical Infrastructure IPM Solution Set - Integrated Performance Measurement SVM EP RAPM Economic Capital Operating Profit Op. Risk Cr. Risk Mkt. Risk FTP Cost Rev. Risk Profit & Loss Middleware Analytical Engines Data Warehousing Operational Data Store General Ledger
1980s 1990s 2000+ Bring together management of profitability and risk under the common objective of generating Shareholder Value Fully integrated profitability and risk information Forward-looking, not just static, management tools This is what most Universal Banks want to achieve Portfolio management Risk-adjusted performance Focus on Revenue and Cost Management Value at risk Transfer pricing Focus on Risk Control Historic Focus Activity-based costing Mark-to-market Current Management Philosophy Is Directed by Historical Information and Does Not Emphasize Forward-looking Approaches to Decision Making It is the completion of a process long since started in most FIs
Operational Risk RiskMeasurement Credit Risk Market Risk Risk Measurement Methodologies
Market Risk Risk Management Methodologies Primary market risksresult from movements in financial markets Secondary riskscapture risks from other market characteristics Liquidity riskresults from the inability to receive fair value
Market Value-at-Risk (VaR) Risk Management Methodologies - Market VaR ƒ • Future Market Value Distributions • Position Risk Horizons • Correlation Between Positions Market/ Position Risk = n
Value-At-Risk represents the “worst case” loss Risk Management Methodologies - Market VaR Risk Management Methodologies - Market VAR “1 in 40 Loss” VAR MTM Losses MTM Gains 83.0% confidence (approximately one standard deviation) 97.5% confidence (approximately two standard deviations) 99.5% confidence (approximately three standard deviations)
Risk Management Methodologies - Market Risk Measurement Techniques 4. Value-At-Risk (VAR) with Correlation 3. Value-At-Risk (VAR) at Instrument Level 2. Basis Point Value (BPV) Approach Increasing Sophistication 1. Notional Amount at Risk
Risk Management Methodologies - Market VaR approaches Risk Management Methodologies - Market VAR Approaches to Calculating Value-At-Risk Monte Carlo Simulation Mean Covariance Approach Historical Simulation “What if” Analysis Scenario Based Approaches
By Product Type….. Value Dashboard
Credit Risk Direct Lending Risk Risk Management Methodologies Counterparty Settlement and Pre-settlement Risk Issuer Risk
Credit Value-at-Risk (VaR) Risk Management Methodologies - Credit VaR ƒ • Future Market Value Distributions • Default Rate Distributions • Recovery Rate Distributions • Portfolio Correlation Effects Expected and Unexpected Credit Losses = n
Risk Management Methodologies - Credit VaR Expected Loss 99th Percentile Loss Level Economic Capital Probability Loss Covered by pricing and provisioning Covered by capital and/or reserves Quantified using scenario analysis and controlled with concentration limits
Actual exposure Potential Exposure Collateral Netting Settlements Risk Management Methodologies - Credit VaR Today's replacement cost, including effect of accruals + Potential changes in value over remaining life of transaction - Net effect of long and short positions - Collateral held to reduce credit exposure + Spot settlements owed or defaulted payments Credit Exposure
Risk Management Methodologies - Credit VaR Maximum Exposure 8 6 Expected Exposure 4 Market Value 2 0 Time
Risk Management Methodologies - Credit Risk Measurement techniques 4. Dynamic Approaches (Monte Carlo and Portfolio Simulations) 3. Mark-to-Market plus a ‘factor’ 2. Mark-to-Market Increasing Sophistication 1. Notional Amount at Risk
Dynamic Approach - Creditmetrics Exposures Value-at-Risk Due to Credit Correlations User Portfolio Credit Rating Seniority Credit Spreads Ratings Series, Equities Series Market Volatilities Rating Migration Likelihoods Recovery Rate In Default Present Value Bond Revaluation Models (e.g., Correlations) Exposure Distributions Standard Deviation of Value Due to Credit Quality Changes for a Single Exposure Joint Credit Rating Changes Portfolio Value at Risk Due to Credit
By Industry Sector ... Value Dashboard
Operational Risk Risk Management Methodologies Improper Authorization Inadequate Documentation Systems Failure Poor Judgment Training / Human errors A special case is event risk, where one or more extreme external events cause a high, un-preventable loss. Fraud Mis-pricing Transaction Processing Errors Under Utilization of Funds Model Errors
By Operational Events….. Value Dashboard
Valuation Models -Standard Calculator - Risk Algorithms The Solution - Systems Architecture Model External Communications External System Interfaces Front Office/Deal Capture Client Information Collection S A L E S & T R A D I N G Documentation Database Confirms / Notices Payments / Settlements Collateral Events Accounting Entries (G/L) Other External Interfaces Event Processing Central Data Repository Trade Entry and Capture - Position Tracking - Transaction Details - Market Data - Economic Details - Transaction History Financial Reporting Risk Control (MIS) Performance Analysis Compliance Other MIS Financial and Management Reporting Trade Pricing Risk Management Market Risk Analysis Credit Risk Analysis Exposures (e.g., Value at Risk) Limits (Available Credit Lines)
EP RAPM Key Metrics Economic Capital Operating Profit Traditional Measurements Risk Profit & Loss The IPM Solution Set - Methodologies SVM Goal • “Best of Breed” • Methodologies Op. Risk Cr. Risk Mkt. Risk Cost Rev. FTP
Rewards to Organisations that implement IPM is tremendous We believe there are big rewards for organisations that can implement IPM: • Improving earnings stability • Understanding sensitivity of earnings to external and internal factors • Management of earnings ‘surprises’ • Awareness of trends • Optimising use of capital • Allocating capital efficiently at enterprise-wide level • Identifying value creating/destroying lines of business • Alignment of capital coverage with risk appetite • Enhancing operational decision-making • Embedding risk in the decision making process • Change from historic to forward-looking management • Decentralized and efficient decision making
IPM enables senior management to answer strategic questions and manage the business with a forward looking approach Integrated Performance Management (IPM) is about bringing Shareholder Value theory into operational reality • Where is my organization creating / destroying value? • Is our organization aligned with our strategy to create value? • Are we meeting shareholder expectations? • How do we compare to our competitors? • What are the areas of future opportunity? • Are we properly compensated for the risks we are taking? • Am I leveraging my IT investment? • Is capital invested in the correct business to optimize value creation? • Are we correctly measuring performance? • Can the business plan and forecast ‘steer’ the correct course?
An Example …Identifying Value Creation or Erosion in the Enterprise... Value Dashboard
Calculation and Allocation of Economic Capital to Business Units and the Bank by Risk Type Retail Banking Customer Finance Wholesale Banking Intl Banking Ins & Invstmnts Central Units The Bank 18m 54m 56m Market 660m 137m 137m Insurance 7m 957m Credit 533m 439m 3,481m 1,207m 872m 385m Operational (event) 228m 911m 79m Operational (business) 178m 116m 323m 103m 120m 851m 86m 80 m 65m Operational & Market Risk dominated Credit Risk dominated
Economic Profit is the key element of this program, integrates profitability and risk and supports historical and forward-looking analysis • Economic Profit sets the performance bar higher by forcing managers to meet not only operating expenses but also all expenses associated with invested capital • A major issue in financial services in defining the capital base • General approach is to apply our capital-at-risk model (consistent with RAPM) to determine the capital which is ultimately employed and thus the amount by which managers are ultimately held accountable Two Equivalent Definitions of Economic Profit (EP): Revenues Return - (RAPM - Cost of Equity) x Economic Capital Operating Expenses Accounting Earnings VaR - Taxes Risk NOPAT Growth (Book Equity - x Cost of Equity) Quality Earnings = Economic Profit = Economic Profit
Value Driver Measurement and Benchmarking Can Provide Additional Focus for Strategic Direction EP by Measurement Center Strategic Assessment by Segment(Business Unit, Product, Region) Return-On-Capital - Cost of Capital (R-C Spread) A Drives Capital Investment to Add Value B C Attractive % Investment Consider Growth/EntryOptions D E SegmentAttractiveness Consider Exit Options Financial Value Driver Benchmark Disadvantaged Advantaged Competitive Position Decides How to Invest and Manage Earnings
Risk-adjusted Capital or Economic Capital Allocated Revenue Allocated cost data G/L Support systems Income Allocation systems Return on Economic Capital = Creditrisk Operationalrisk Market risk Insurancerisk G/L _ = Economic Capital EquityProfit Risk systems Cost of Equity Value Contribution to Shareholder Support systems = Economic Capital
Source Data Traditional ERP Financial & Management Accounting External Feeds Transaction Capture Ad hoc Reporting Blended Reporting Discrete Reporting Integrated Reporting Operational Systems Operational Data Store • Front office • Middle office • Back office Translation & Mapping Business Support Systems Analytical Engines • HR • Benefits Summarization & Posting Non-Automatic Inputs Technology Blueprint Information Processing and Storage Information Presentation Translation Processor (Middleware)
Ad hoc Reporting Blended Reporting Integrated Reporting To integrate and deliver all the information in an efficient manner, the technology architecture has to be flexible and scalable • Flexibility • Leverage existing investments • Support plug-in best of breed applications • accelerated organizational changes due to shorter, less costly implementations • Facilitates integration of new systems (M&A) • Scalability • Accommodate growth in the organization • support high volumes of transactions and level of detail • enhance timeliness of delivery due to capacity Source Data Translation Processor (Middleware) Information Processing and Storage Information Presentation Traditional IT Process Financial & Management Accounting External Feeds Summarized financial postings Transaction Capture • Market data • Credit ratings Drill down to detail Discrete Reporting Operational Systems Operational Data Store Translation & Mapping • Fixed income • Foreign exchange Transaction detail Web based report viewer Business Support Systems Analytical results Calculation Engines • Payroll • Benefits Summarization & Posting • Detailed financial postings • Business events • Reference data Non-Automatic Inputs • Manual entries Algorithmics Risk Watch
Process Reengineering Project Management Technical Infrastructure IPM Solution Set SVM EP RAPM Economic Capital Operating Profit Op. Risk Cr. Risk Mkt. Risk FTP Cost Rev. Risk Profit & Loss Middleware Analytical Engines Data Warehousing Operational Data Store General Ledger
Building Sound Internal Controls Integrity and Accuracy of Records and Reports Effective Operations Reliable Reporting Reconciliation Control Why Internal Controls? “Building” the Under- standing in the Bank for Adequate Oversight Internal Controls Testing Risk Management Process periodicaly External Auditing Evaluation of the Independence and Effectiveness of Risk Management Functions Building Safe systems Based on the objective of the Sound Internal Controls to provide strategic as well as operational decision support, this will be a major (joint) bank-wide effort.