Download
1 / 17
170 likes | 301 Views
Dual-Polarimetric Radar Observations of Mesoscale Phenomena. Jason W. Godwin. Outline. Introduction Radar basics Dual-polarimetric (dual-pol) basics Severe local s torms Hail detection Tornado debris signature Heavy precipitation Hydrometeor Classification Algorithm (HCA)

E N D
Dual-Polarimetric Radar Observations of Mesoscale Phenomena Jason W. Godwin
Outline • Introduction • Radar basics • Dual-polarimetric (dual-pol) basics • Severe local storms • Hail detection • Tornado debris signature • Heavy precipitation • Hydrometeor Classification Algorithm (HCA) • Quantitative Precipitation Estimation (QPE) • Conclusion/summary
Radar Basics • RADAR = Radio Detection and Ranging • Radar equation (power returned) for an isolated target: • G is the antenna gain • Lambda (λ) is the radar frequency • Pt is the transmitted power • Sigma (σ) is the radar cross section • r is the distance between the target and transmitter • Basically, a radar will measure power returned that is reflected off of a target.
Conventional Radar • A signal is transmitted from the radar, reflected off of a target, and returned to the radar. • Power returned is measured according to the radar equation. • Distance is measured according to the time it takes for the signal to return (signal is travelling at the speed of light). • Available basic products: reflectivity (Z). Conventional Radar
Doppler Radar • With Doppler radar, the phase shift of the returned radar pulse is compared against the phase of the emitted pulse. The amount of phase shift can be used to determine the radial velocity of the target. • Nyquist velocity: there is a maximum unambiguous velocity (dependent upon the wavelength and pulse repetition frequency of the radar) that can be measured using phase shift alone before the phase “folds over”. Velocities above this so called Nyquist velocity must be dealiased. • Available basic products: Z, velocity (V), and spectrum width (W). • Often, storm relative velocity (SRV) will be used. Radar velocity imagery showing a cyclonic tornadic circulation over Jefferson Davis Parish, Louisiana on 22 Oct. 2009
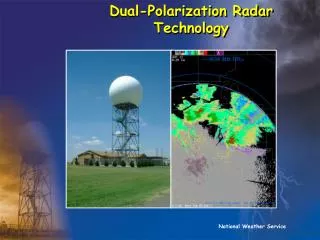
Dual-Pol Radar • Polarization is perpendicular to the direction of the electromagnetic wave propagation (Zrnic and Ryzhkov, 1999). • The beam is emitted such that there is a horizontal and vertical component to the polarization. • The returned pulse’s individual components can be measured and compared. • Available products: Z, V, W, ZDR, rho, and KDP. Diagram of dual-pol radar (source: NOAA/NWS Radar Operations Center)
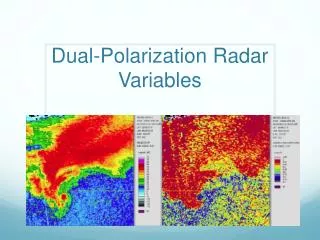
Basic Radar Products Reflectivity (Z): log10 of the power returned Velocity (V): radial velocity of target These radar images are from a squall line event that moved through southeastern Louisiana on April 11, 2013.
Basic Radar Products Spectrum Width (W): variance of velocities within one radar bin (Doviak and Zrnic, 1984) Differential reflectivity (ZDR): log10 of the ratio of horizontal to vertical power returned These radar images are from a squall line event that moved through southeastern Louisiana on April 11, 2013.
Basic Radar Products Correlation Coefficient (ρ): correlation of horizontal and vertical power returned within a radar bin Specific differential phase (KDP): difference in propagation between horizontal and vertical channels over a distance These radar images are from a squall line event that moved through southeastern Louisiana on April 11, 2013.
Severe Local Storms: Hail Detection • Hail stones are approximately spherical, but also “appear” spherical to a radar due to their tumbling motion. • This means the ratio of horizontal to vertical power would be about 1, meaning the ZDR (because it is the log10) would be about zero. • Since hailstones are generally quite large compared to raindrops, we would also expect to find large Z. • What to look for: a region of high Z, but low ZDR.
Severe Local Storms: Hail Detection Reflectivity (Z) Differential Reflectivity (ZDR) Radar images showing a large hail core associated with a tornadic supercell south of Oklahoma City on May 10, 2010
Severe Local storms: Tornado Debris Signature • Debris within a tornado (especially a strong tornado) is very non-uniform (i.e. tree branches, building materials, etc.), so we would expect it to have a low correlation coefficient (Ryzhkov et al., 2005). • The debris is also larger than a typical hydrometeor, so we could also look for high reflectivity values. Radar velocity scan from 24 May 2011 Chickasha, Oklahoma tornado
Severe Local storms: Tornado Debris Signature Reflectivity (Z) Correlation Coefficient (ρ) Radar images showing a tornado debris signature from an EF-4 tornado near Chickasha, Oklahoma on May 24, 2011
Hydrometeor Classification Algorithm (HCA) • Dual-pol radar gives us the ability to classify radar targets using a “fuzzy logic” algorithm (Park et al., 2009). This algorithm also makes it easier to distinguish between meteorological targets and clutter. • The algorithm is a best guess of the target type at the beam level, not the surface. • Classifications:hail, graupel, big drops, small drops, wet snow, dry snow, ice, ground clutter, biological, and unknown. HCA product showing hail at the leading edge of a squall line with stratiform rain behind it. Notice the snow and ice being detected far from the radar. This is because the beam elevation at these largest distances is above the freezing level.
Quantitative Precipitation Estimation (QPE) • By being able to determine the hydrometeor type, a set of rainfall-reflectivity relationships can be used to more accurately estimate precipitation accumulation (Giangrande and Ryzhkov, 2008). • This technology was one of the key selling points to fund the National Weather Service dual-pol radar upgrade, as flooding and hydrological events are the costliest and deadliest weather-related hazard in the United States.
References • Doviak, R.J., and D.S. Zrnic, 1984: Doppler Radar and Weather Observations. Academic Press, Inc., 458 pp. • Giangrande, S.E., A.V. Ryzhkov, 2008: Estimation of Rainfall Based on the Results of Polarimetric Echo Classification. J. Appl. Meteor. Climatol., 47, 2445–2462. • Park, Hyang Suk, A. V. Ryzhkov, D. S. Zrnic, Kyung-EakKim, 2009: The Hydrometeor Classification Algorithm for the Polarimetric WSR-88D: Description and Application to an MCS. Wea. Forecasting, 24, 730–748. • Ryzhkov, A.V., T.J. Schuur, D.W. Burgess, D.S. Zrnic, 2005: Polarimetric Tornado Detection. J. Appl. Meteor., 44, 557–570. • Zrnic, D.S. and A.V. Ryzhkov, 1999: Polarimetry for Weather Surveillance Radars. Bull. Amer. Meteor. Soc., 80, 389–406.