Download

1 / 32
350 likes | 630 Views
Mark Ratzer February 26 th , 2011 WFO Chicago 2 nd Annual Aviation Weather Workshop. Dual-polarization Radar. TIMELINE OF DUAL-POL IMPLEMENTATION. ** KLOT will be part of the Beta-Test period – March 2011 (This timeline has moved back slightly).

E N D
Mark Ratzer February 26th, 2011 WFO Chicago 2nd Annual Aviation Weather Workshop Dual-polarization Radar
TIMELINE OF DUAL-POL IMPLEMENTATION ** KLOT will be part of the Beta-Test period – March 2011 (This timeline has moved back slightly)
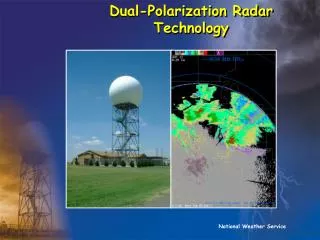
HOW DOES DUAL-POL WORK? Radio waves are simply a series of oscillating electromagnetic fields. These waves can have different orientation (or polarization). From a graphical standpoint you can imagine two different orientations of these electromagnetic fields: Polarization currently used by WSR-88D’s
HOW DOES DUAL-POL WORK? By transmitting both horizontally and vertically polarized signals, increased information will be available including information about the shape of the hydrometeors with dual polarization radar.
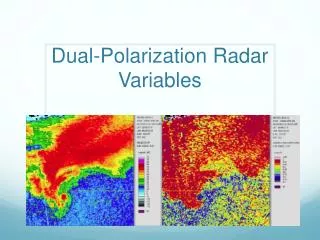
DUAL-POL BASE DATA All of the “legacy” products will be available that are currently being created: - Base Velocity (V) - Spectrum Width (SW) - Reflectivity for Horizontal Polarization (Z) New products that will be available: - Differential Reflectivity (ZDR) - Correlation Coefficient (CC) - Differential Phase (DP) We will examine these more closely in a bit.
DIFFERENTIAL REFLECTIVITY (ZDR) • A ratio of the reflected horizontal and vertical power returns • ZDR proportional to: Horizontal Power Returned Vertical Power Returned • Depends on the median shape and size of hydrometeors
DIFFERENTIAL REFLECTIVITY (ZDR) • Examples of different ZDR values • ZDR > 0 Represents horizontally-oriented mean profile of hydrometeor Ev Eh ZDR < 0 Represents vertically-oriented mean profile of hydrometeor EV Eh ZDR ~ 0 Represents nearly circular mean profile of hydrometeor EV EV
WHY LOOK AT ZDR?! - The shape of the hydrometeors can be inferred, and the presence of larger drops can be indicated - Hail shafts can also be more easily identified. Hail often times takes on a more spherical shape, and ZDR values closer to zero would likely indicate the presence of hail
WHY LOOK AT ZDR?! Differential Reflectivity (ZDR) Reflectivity (Z) The new differential reflectivity product will allow to more closely pinpoint location of largest hail in thunderstorms (areas of ZDR near zero)
WHY LOOK AT ZDR?! ZDR Z Note the area of low reflectivity (Z) coincides with high values of differential reflectivity (ZR). Insects are less reflective than precipitation targets and usually have more horizontal extent than vertical when flying through the air.
WHY LOOK AT ZDR?! ZDR also will be very useful for winter applications, here note the decrease in ZDR associated with winter precip event indicating transition from liquid to snow.
WHY LOOK AT ZDR?! Another case from convective season…a strong updraft shows up on the ZDR product on the right. ZDR values greater than 1 indicate presence of liquid water drops, and this is at a level where temperatures are around -10 deg C. This indicates presence of supercooled water drops associated with strong updrafts in the storm.
ZDR ADVANTAGES • Based on value of ZDR, radar operator can make inferences as to hydrometer type • Small positive values of ZDR up to about 1.5 indicate liquid drops generally greater than 1-2 mm. • ZDR values > 3 indicate very large liquid drops with perhaps even ice core (5 mm drops or greater). • Convective updrafts and hail shafts can be identified using ZDR • Winter time applications include identifying melting layer and the changes in elevation of the melting layer through time • False echoes (ground clutter) can be more readily identified by using a combination of Z and ZDR
ZDR LIMITATIONS • Susceptible to the same data quality limitations as traditional reflectivity • Attenuation and degraded signal through heavy precipitation areas • Same VCP’s are used and data still susceptible to range folding
CORRELATION COEFFICIENT(CC) • A measure of the correlation of the horizontal and vertical back scattered power within a radar sample volume. • VALUE • 0.96 to 1 Small diversity in hydrometeors within the sample volume • 0.85 to 0.95 Large diversity in hydrometeors • Less than 0.85 Non-hydrometeorological targets
CORRELATION COEFFICIENT(CC) Area of weaker returns west of higher reflectivity, characterized by lower values of CC, indicating non-meteorological targets (likely insects in this case)
CORRELATION COEFFICIENT(CC) In this winter precipitation example, the area of high reflectivities on the right side of the left panel of traditional reflectivity is in an area of high correlation coefficient indicating hydrometeors of all the same size (likely all snow). The other two areas of higher reflectivity are characterized by lower values of CC indicated likely mixed precipitation.
CORRELATION COEFFICIENT(CC) Note at 07z CC values remain high indicating primarily snow aloft. Two hours later at 09z, ring of lower CC values indicate mixed phase precip with higher CC values again closer to the radar indicating all rain near the surface.
CORRELATION COEFFICIENT(CC) A radar signature commonly referred as “Tornado Debris Signature” (TDS) can be identified with dual-pol radar. Hook echo region of supercell can sometimes be characterized by area of enhanced reflectivity with low ZDR values and low CC values.
CC ADVANTAGES • Based on value of CC, you can infer a size distribution of hydrometeors. • Large values of CC indicate fairly uniform size and shape distribution of hydrometeors. • Slightly less large values of CC indicate more hydrometeor diversity and likely mixed phase precipitation. • Winter time applications with identification of “bright band”. • Lower values of CC usually indicate non-meteorological targets, although low CC can also indicate VERY large hail in some instances.
CC LIMITATIONS • Susceptible to data limitations of all radar products including range folding, beam attenuation, etc. • CC has not performed well in test mode for areas of weak reflectivity. Affected by low signal to noise ratios.
SPECIFIC DIFFERENTIAL PHASE (KDP) • Represents the difference in phase shift between horizontal and vertical polarized returned energy due to forward propagation. • - Horizontal phase shift is greater than vertical phase shift.
SPECIFIC DIFFERENTIAL PHASE (KDP) The KDP values are highest where this phase shift occurs. Thus, high values of KDP indicate areas of heavy rainfall with more liquid precipitation. An example is shown below dealing with greater rainfall rates associated with a squall line:
KDP ADVANTAGES • Excellent product to capture higher rainfall rates with certain storms. • Can be used in conjunction with CC to eliminate areas of ground clutter (cleaning up precip estimate maps to include primarily meteorological targets!!).
KDP LIMITATIONS • Often times can be very noisy product making interpretation challenging at times. • Often becomes unreliable at larger distances away from radar. • Ignores areas with CC values less than 0.87 which sometimes can be associated with a signature for very large hail. Some areas of precipitation may thus be missed.
DUAL-POL RADAR INTERPRETATION What type of hydrometeor properties do you think might be occurring inside the white circle on these three cross sections of (Z, ZDR, and KDP)
OTHER DERIVED PRODUCTS Hydrometeor Classification Algorithm (HCA) – attempts to assign a hydrometeor classification to each radar range bin. Currently 11 different types of classifications are possible in the algorithm: GC/AP - ground clutter or AP BS – biological scatterers DS – dry aggregated snow WS – wet snow CR – crystals GR – graupel BD – “big drops” RA – light and moderate rain HR – heavy rain HA – hail (possibly mixed with rain) UK – unknown - These above classifications are projected onto an output grid and can be overlaid with base data to help with radar interpretation.
OTHER DERIVED PRODUCTS • Melting Layer Detection Algorithm (MLDA) – algorithm developed to identify melting layers and can be overlaid on base data display to help with radar interpretation • QPE – Quantitative Precipitation Estimate will be improved with dual-pol and instantaneous precipitation rates will be available. Initial field tests have shown dramatic improvements in radar estimated precipitation over the traditional Z-R relationships from WSR-88D’s.
OTHER BENEFITS OF DUAL-POL DATA • Increased lead time for flash flood and winter storm warnings. • Possible detection of aircraft icing conditions • Improved rainfall estimation will lead to improve streamflow forecasts and better hydrologic services. • It has been estimated that dual-pol radar will have the potential to save the public approximately 700 million dollars annually based on all the improvements mentioned.