Download
1 / 33
330 likes | 473 Views
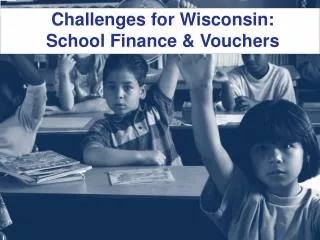
Challenges for Wisconsin: School Finance & Vouchers. Road Map. Wisconsin’s Challenge Revenue Limits & General School Aids Expanding Private School Vouchers Is There A Better Way Forward For All Kids?. Wisconsin’s challenge. Wisconsin Schools Perform Well.

E N D
Road Map • Wisconsin’s Challenge • Revenue Limits & General School Aids • Expanding Private School Vouchers • Is There A Better Way Forward For All Kids?
Wisconsin Schools Perform Well Accountability Rating for Wisconsin Schools Nearly 9 out of 10 (86%) rated schools meet expectations or better.* Only 4% fail to meet expectations. *Excludes schools that did not receive a rating. Source: Wisconsin Department of Public Instruction. District and School Report. http://reportcards.dpi.wi.gov/
But Poverty is Growing in WI…Change in Free & Reduced Lunch (2001-2012) Wisconsin FRL Rate Doubles 2001: 21%2012: 43% In many rural districts, more than half the students are eligible for free-and-reduced lunch. Source: Wisconsin Department of Public Instruction. School Finance Maps. http://dpi.wi.gov/sfs/maps.html
And Poverty Impacts Achievement(2012-13 Report Card Data) HIGH-poverty, LOW-performing schools LOW-poverty, HIGH-performing schools Avg. FRL There is a very strong correlation between poverty and school performance. Source: Wisconsin Department of Public Instruction. School and District Report Cards http://reportcards.dpi.wi.gov/
Wisconsin is Increasingly Diverse… Source: Wisconsin Department of Public Instruction & University of Wisconsin –Madison, Applied Population Laboratory. Raw Data Source: National Center for Education Statistics (NCES) 2009. http://nces.ed.gov/
But Students of Color are More Likely to Attend a Low-Performing School Source: Wisconsin Department of Public Instruction. School and District Report Cards http://reportcards.dpi.wi.gov/
…And Rural Schools Face Specific Challenges • Rural schools face specific challenges, such as: • Declining enrollment; • Growing poverty; • Staff shortages; • Higher transportation costs; and • Increasing numbers of English Language Learners (ELL). • Small schools have less economy of scale, making technology and infrastructure investments more expensive (fewer students to absorb fixed costs). • Rural districts generally have fewer support staff and administrators (the superintendent often times is the high school principal and business administrator), meaning there fewer staff to implement state and federal initiatives. • Rural educators often receive lower compensation and wear many hats, requiring high levels of certification and commitment.
2012-13 Wisconsin School Revenue • 88% of schools funds come from state and local sources. • State and local funding efforts are roughly split 50-50. $10.7 Billion Source: Wisconsin Department of Public Instruction. School District Revenue Limits http://sfs.dpi.wi.gov/sfs_revlim 2013-15 State Budget. http://news.dpi.wi.gov/news_2013-15-state-budget-information
School Funding – Simplified! Outside the Revenue Limit
During the Great Recession, Revenue Limits Were Cut … Source: Department of Public Instruction. 2011-13 State Budget. http://pb.dpi.wi.gov/pb_11-13_budget2013-15 State Budget. http://news.dpi.wi.gov/news_2013-15-state-budget-information
And for 20 Years State AidHas Not Kept Pace With Inflation • After accounting for inflation, general aid per pupil was at least $500 less in 2011-12 than it was in 2000-01. Source: Department of Public Instruction. 2011-13 State Budget. http://pb.dpi.wi.gov/pb_11-13_budget2013-15 State Budget. http://news.dpi.wi.gov/news_2013-15-state-budget-information
While Categorical Aid Reimbursement Rates Have Fallen • Reimbursement rates for special education (36% to 26%) and bilingual-bicultural (18% to 8%) services have dropped 10 percentage points since 2000-01. Source: Department of Public Instruction. 2011-13 State Budget. http://pb.dpi.wi.gov/pb_11-13_budget2013-15 State Budget. http://news.dpi.wi.gov/news_2013-15-state-budget-information
Which has Resulted in Significant Staff Reductions Wisconsin schools cut more than 3,000 educatorsduring the Great Recession. Source: Department of Public Instruction. 2011-13 State Budget. http://pb.dpi.wi.gov/pb_11-13_budget2013-15 State Budget. http://news.dpi.wi.gov/news_2013-15-state-budget-information
Most Kids Attend Public School Total Enrollment (2013-14) Public Schools: 875,000 Private Schools: 120,000 Source: Department of Public Instruction. Public School Enrollment Data http://lbstat.dpi.wi.gov/lbstat_pubdata3Private School Enrollment Data http://lbstat.dpi.wi.gov/lbstat_privdata
Where do Open Enrollment Kids Go? Open Enrollment (2013-14): 46,500 (5.3% of Public School Enrollment) Source: Department of Public Instruction. Public School Enrollment Data http://lbstat.dpi.wi.gov/lbstat_pubdata3Private School Enrollment Data http://lbstat.dpi.wi.gov/lbstat_privdata
Charter Schools & Independent (2r) Charters Schools In 2013-14, Wisconsin had: • 242 charters schools with • 47,600 students. Charters are public schools that are generally authorized by the local school board. However, Milwaukee and Racine have independentcharter schools that are created by: • UW – Milwaukee (12) • City of Milwaukee (10) • UW – Parkside (1) • Milwaukee Area Technical College (0) The 23 Independent (2r) charter schools enroll 8,400 students, but are funded differently. Independent charter schools are 100% state funded (no property tax), but only receive $7,925 per-pupil ($8,075 in 14-15). However, this state funding is created by withholding ≈1.4% of every district’s general aid and redirecting it to the independent charters. Local districts then can increase their property taxes to make up the difference – essentially raising property taxes statewide. Source: Department of Public Instruction. Charter Schools in Wisconsin. http://sms.dpi.wi.gov/sms_csindex
There are Now Three “Voucher” or Parental Choice Programs (PCP) Source: Department of Public Instruction. Private School Choice Programs - Facts & Figures. http://sms.dpi.wi.gov/choice_facts_statistics
Voucher Programs Started Small, But Have Grown Over Time In 1998, the State Supreme Court ruled that religious schools could participate in the voucher program. In 1990-91, the Voucher Program cost ≈ $734,000 In 2014-15, the Voucher Program will cost: ≈ $212,000,000 Source: Department of Public Instruction. Private School Choice Programs - Facts & Figures. http://sms.dpi.wi.gov/choice_facts_statistics
Most Students in Voucher Schools are Publicly-Funded • Milwaukee PCP average:79% • Racine PCP average: 44% • Wisconsin PCP average: 4% • All PCP schools average: 64% The % of voucher-funded students in participating schools (particularly K-8 schools) tends to grow over time. Source: Department of Public Instruction. Private School Choice Programs - Facts & Figures. http://sms.dpi.wi.gov/choice_facts_statistics
…And Most Statewide Voucher Students Came From Private Schools 2013-14 Statewide Choice Program Enrollment: 2/3rds of the students were already enrolled in private schools Source: Department of Public Instruction. Private School Choice Programs - Facts & Figures. http://sms.dpi.wi.gov/choice_facts_statistics
In the Last Budget, Voucher Schools got the Biggest Increase… Per-Pupil Revenue Increase by School Type $1,414 Public schools also get a $75 per student categorical aid for all kids. Source: Department of Public Instruction. 2013-15 State Budget Information. http://news.dpi.wi.gov/news_2013-15-state-budget-information
However, Voucher Schools Still Get Less Per-Pupil Funding Per-Pupil Revenue Authority by School Type Public school revenue has not caught up to the 2010 funding level. Source: Department of Public Instruction. 2013-15 State Budget Information. http://news.dpi.wi.gov/news_2013-15-state-budget-information
Although the Funding Gap is Narrowing Progress toward funding parity is achieved by cutting public school revenue limits, while increasing voucher and independent charter payments. Source: Department of Public Instruction. 2013-15 State Budget Information. http://news.dpi.wi.gov/news_2013-15-state-budget-information
A Voucher in Every Backpack? What would universal vouchers with public school funding parity cost? Let’s do the math… Total additional (marginal) cost for universal vouchers: • $ 1,026,116,318 ($1 billion) Source: Department of Public Instruction. 2013-15 State Budget Information. http://news.dpi.wi.gov/news_2013-15-state-budget-informationNote: calculations are updated to determine marginal, rather than total program costs.
Overall, Students Perform Similarly Across Sectors Source: Department of Public Instruction. “Last year for WKCE math and reading; results improve over five years.” http://news.dpi.wi.gov/files/eis/pdf/dpinr2014_47.pdf “Fourth Year of Choice Data.” http://news.dpi.wi.gov/files/eis/pdf/dpinr2014_48.pdf
Legislative Efforts Here are some legislative proposals that address these issues: • Fair Funding School Finance Proposal (State Superintendent Evers’ 2013-15 State Budget proposal) • Voucher School Report Cards (Passed)(2013 SB 286 – Sen. Olsen, Rep. Kestell) • Increasing Special Education & Sparsity Reimbursement Rates(2013 AB 772 – Rep. Mason; 2013 AB 834 Rep. Clark) • Pre-Accreditation for Voucher Schools (Passed) (2013 SB 584 – Sen. Vukmir) • Rural Teacher Loan Forgiveness(2013 AB 817 – Rep. Wright) • Restoring 2/3rds State Funding for Education(2009 AB 919 – Reps. Davis, Strachota, Brooks, Honadel, Kestell, Kleefisch, Knodl, LeMahieu, Lothian, Townsend and Vos)
Bottom Line Wisconsin must meet the challenge of growing poverty and increasingly diverse classrooms. • Students and families have more options and choices than ever before (neighborhood schools, charters, vouchers, open enrollment, or virtual charters). • But we have to close our achievement gaps and expand personalized learning for all students. • And rural schools deserve the resources to meet the needs of their students without continuous referenda. Together, we can do better….