Download
1 / 2
20 likes | 121 Views
This simulation analyzes stability in 5 quadrupole groups and error distribution in beam size. Various error scenarios and their impact are considered to enhance understanding of system stability and error correction factors. Results provide valuable insights for optimization.

E N D
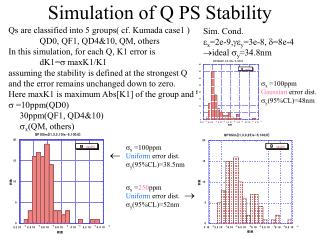
Simulation of Q PS Stability Qs are classified into 5 groups( cf. Kumada case1 ) QD0, QF1, QD4&10, QM, others In this simulation, for each Q, K1 error is dK1=s maxK1/K1 assuming the stability is defined at the strongest Q and the error remains unchanged down to zero. Here maxK1 is maximum Abs[K1] of the group and s =10ppm(QD0) 30ppm(QF1, QD4&10) sx(QM, others) Sim. Cond. ex=2e-9,gey=3e-8, d=8e-4 ideal sy=34.8nm sx =100ppm Gaussian error dist. sy(95%CL)=48nm sx =100ppm Uniform error dist. sy(95%CL)=38.5nm sx =250ppm Uniform error dist. sy(95%CL)=52nm
Simulation of B,Q&SX PS Stability Magnet groups QD0, QF1, QD4&10, QM, otherQ, SX, Bchi, B Error : dKN=s maxKN/KN Here maxKN is maximum Abs[KN] of the group s =10ppm(QD0, QF1, QD4&10,B) sPS(QM, otherQ, SX, Bchi) Error distribution: uniform in ± dKN ( For 4 chicane Bs(Bchi) errors are the same assuming they are connected in series.) Simulation is for FF only. Oct&Dec are excluded since KN=0 for them Measured beam size is defined smea2=sy2+Dy2 sPS =100ppm smea(95%CL)=38nm sPS =250ppm smea(95%CL)=69nm Contribution of dy is small: Dy2(95%CL)=7e-18m2 for both case. H Bend stability H orbit & beam size: For sPS =100ppm, Dx2(95%CL)=5e-10m2, smea x (95%CL)=22.5um ! ( Maybe we do not care about this )